
Educational Resources
Storm disrupts Portugal as presidential run‑off election approaches
Portugal finds itself grappling with a multifaceted crisis as severe storms, known as Storm Kristin and ...
TAMFIS NIG LTDRC 8067447CAC ACTIVEFinima, Bonny Island, Rivers State

Data acquisition and signal processing form the cornerstone of modern engineering and scientific research. This guide makes the core concepts interactive, allowing you to explore the journey from a real-world analog signal to meaningful digital information. Use the navigation to explore different topics or scroll to begin.
The entire data acquisition process can be visualized as a chain of events. An analog signal from the real world is conditioned, converted to digital, processed, and potentially converted back to analog. This application explores each key stage.
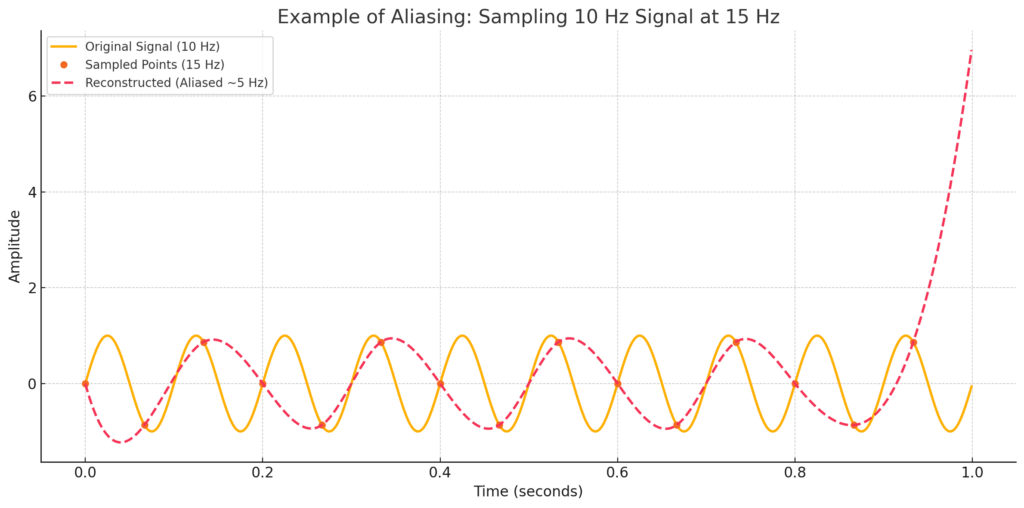
Sampling is the process of converting a continuous signal into a discrete sequence of values. The rate at which you sample is critical. The Nyquist-Shannon theorem states that the sampling frequency ($f_s$) must be at least twice the maximum frequency in the signal ($f_{max}$) to avoid distortion. This is expressed as: $f_s \ge 2 \times f_{max}$.
Use the sliders below to see how the sampling rate affects the reconstructed signal. When the sampling rate is too low, a high-frequency signal can falsely appear as a lower-frequency one—a phenomenon called aliasing.
An ADC transforms a continuous analog voltage into a discrete digital number. This involves two steps: sampling (capturing the signal at time intervals) and quantization (mapping the captured voltage to a number). There are many ADC architectures; below, we explore the common Successive Approximation Register (SAR) type.
A SAR ADC works like a binary search. It successively compares the input voltage to fractions of a reference voltage to determine each bit of the digital output, from most significant (MSB) to least significant (LSB). Adjust the input voltage to see the process unfold for a 4-bit ADC with a 5V reference.
Real-world signals are often contaminated by unwanted noise. Filters are used to remove or attenuate these undesirable frequency components. Filters can be analog (built with physical components) or digital (implemented as software algorithms). Digital filters are highly flexible and reproducible.
Different filter designs offer trade-offs between performance characteristics. A key application is anti-aliasing, where a low-pass filter is used to remove frequencies above the Nyquist limit before sampling. Click the buttons to see the frequency response of different classic IIR filter types.
Once data is digitized, it must be stored and analyzed to extract meaningful insights. The strategies for logging and analysis depend heavily on the application, from continuous monitoring to capturing rare, high-speed events.
Data acquisition and signal processing form the cornerstone of modern engineering and scientific research. This guide explores the essential concepts and techniques employed in data acquisition systems, providing both theoretical foundations and practical insights. We examine critical processes such as signal sampling, conversion between analogue and digital domains, filtering techniques for noise reduction, and methods for effective data logging and analysis.
The journey from analogue signals in the physical world to meaningful digital information requires careful consideration of sampling theory, conversion accuracy, signal conditioning, and processing algorithms. Understanding these principles is crucial for designing robust systems that can reliably capture and interpret the wealth of information present in real-world signals.
The entire data acquisition process can be visualised as a chain of events. An analogue signal from the real world is conditioned, converted to digital, processed, and potentially converted back to analogue.
Process Flow Diagram:
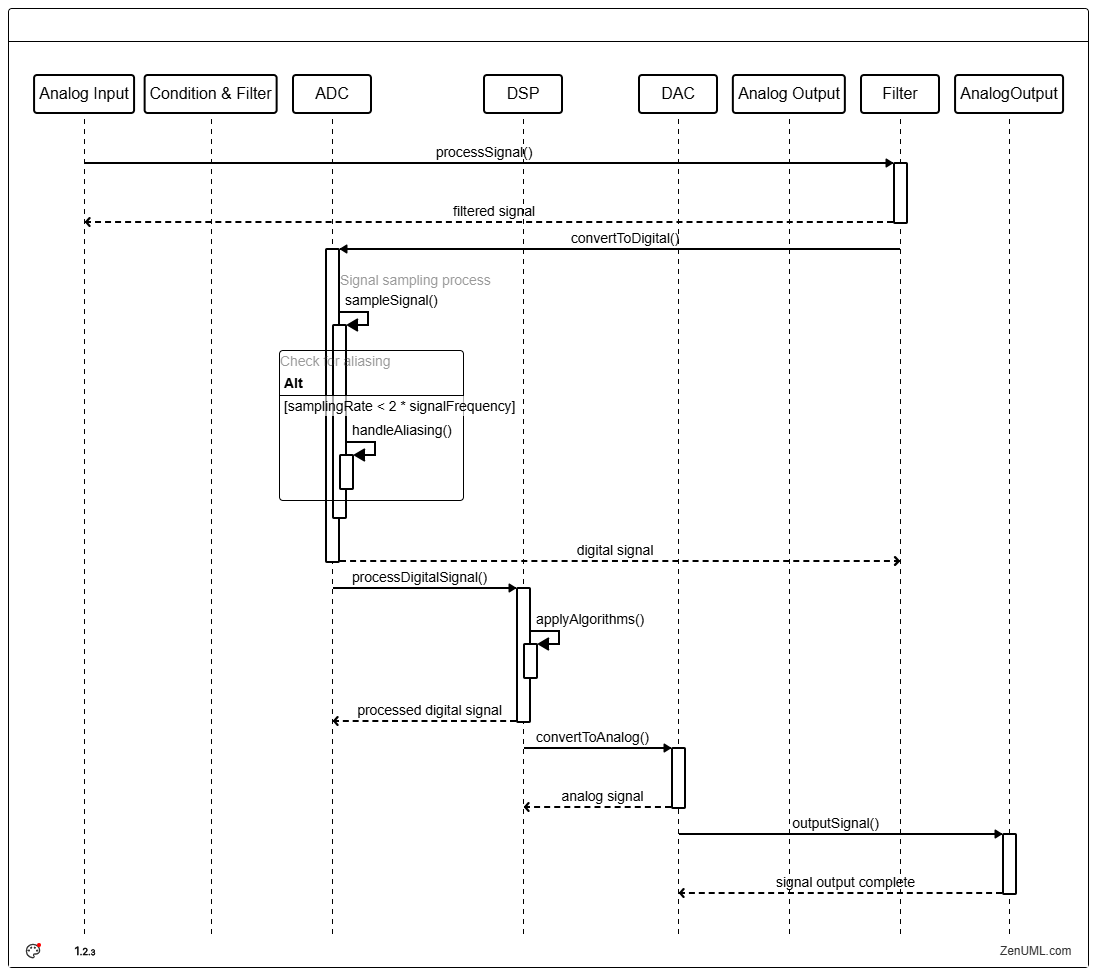
Analogue Input → Condition & Filter → ADC → Digital Signal Processor (DSP) → DAC → Analogue Output
Sampling is the process of converting a continuous signal into a discrete sequence of values. The rate at which you sample is critical. The Nyquist-Shannon theorem states that the sampling frequency (fs) must be at least twice the maximum frequency in the signal (fmax) to avoid distortion. This is expressed as: fs≥2×fmax.
Aliasing occurs when high-frequency components in the input signal appear as lower-frequency components in the sampled data. This phenomenon results from the periodic nature of the sampling process and represents one of the most significant challenges in data acquisition system design.
Example of Aliasing (Conceptual Diagram):
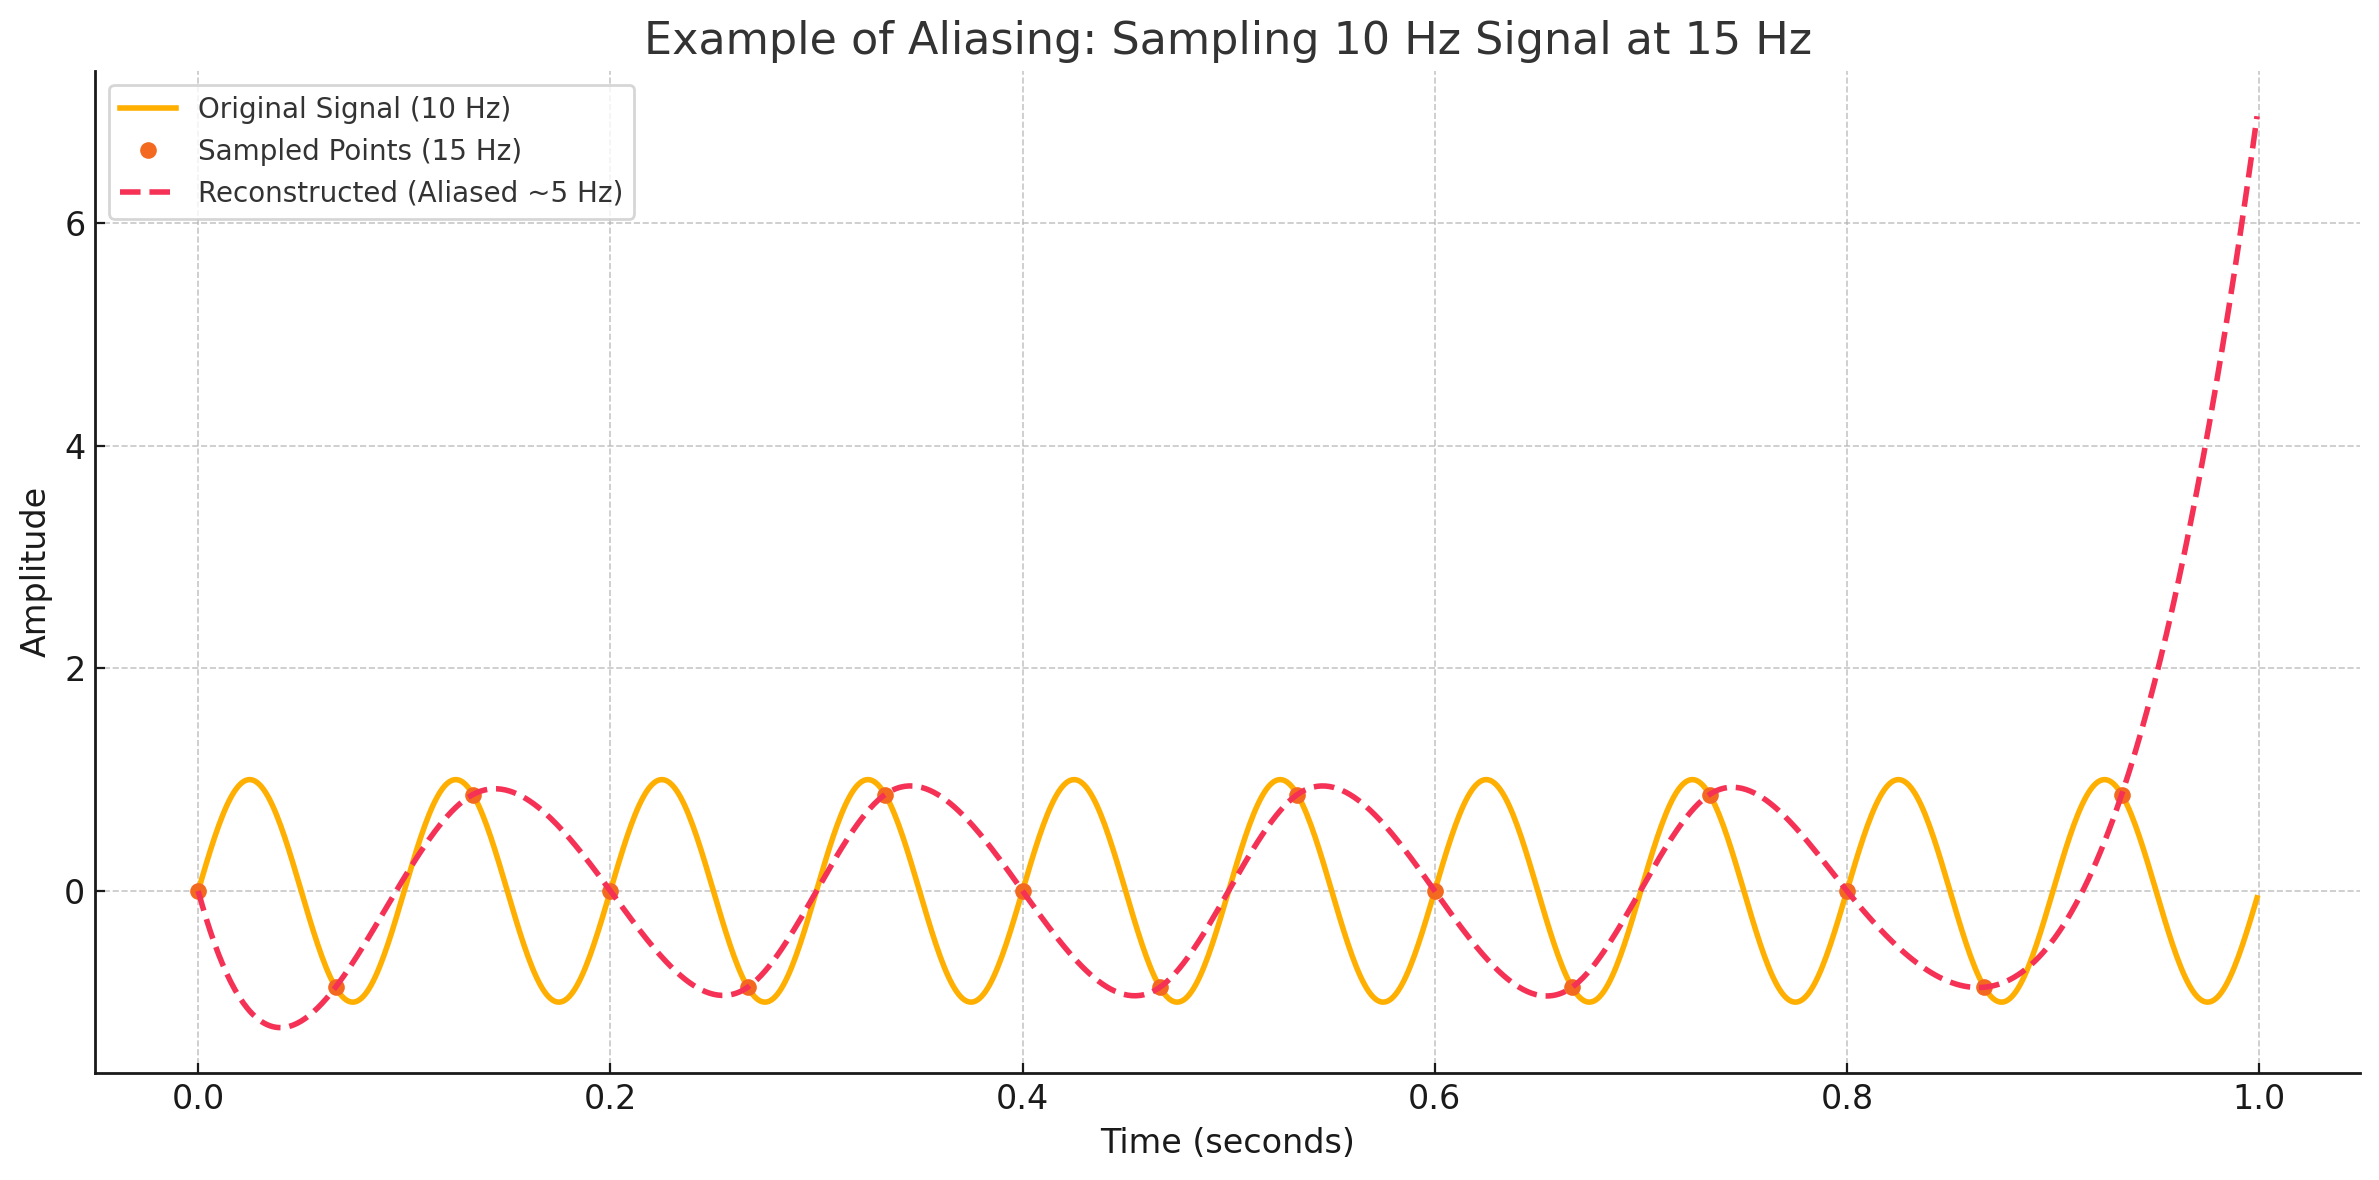
If the sampling rate is too low (less than twice the signal’s maximum frequency), the reconstructed signal will not accurately represent the original, leading to distortion.
An ADC transforms a continuous analog voltage into a discrete digital number. This involves two steps: sampling (capturing the signal at time intervals) and quantization (mapping the captured voltage to a number).
A SAR ADC works like a binary search. It successively compares the input voltage to fractions of a reference voltage to determine each bit of the digital output, from most significant (MSB) to least significant (LSB).
SAR ADC Simulation Example (for a 4-bit ADC with 5V reference, Input: 3.70V):
Keep reading
Educational Resources
Portugal finds itself grappling with a multifaceted crisis as severe storms, known as Storm Kristin and ...
Educational Resources
Twilight Fish Study Uncovers Unique Hybrid Eye Cells | Mirage News is a topic that deserves thorough exp...
TAMFIS NIG LTD
Electrical and instrumentation engineering, bid preparation and consulting, IT and software.