Video
construction project management | How To Manage A Construction Project Step By Step
Construction project management is a complex discipline that involves coordinating multiple stakeholders...
TAMFIS NIG LTDRC 8067447CAC ACTIVEFinima, Bonny Island, Rivers State

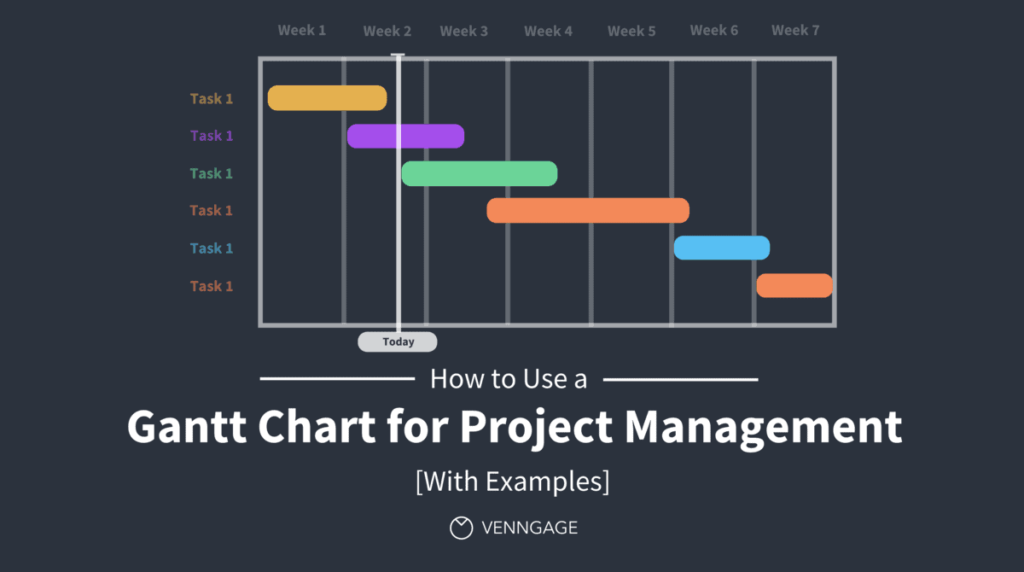
Gantt charts are essential tools in project management, providing clear visual timelines that help teams track progress, deadlines, and task dependencies. While Microsoft Project is a popular choice for creating detailed Gantt charts, many project managers prefer the flexibility and accessibility of Excel. In this article, we delve into how you can create the best Gantt chart in Excel that looks and functions similarly to Microsoft Project. Whether you're managing small tasks or complex projects, this guide will empower you to visualize your project timeline effectively.
Gantt charts are powerful visualization tools that map out project schedules by displaying tasks along a timeline. They enable project managers to allocate resources efficiently, monitor progress, and identify potential bottlenecks. By illustrating task durations and dependencies, Gantt charts facilitate better communication among team members and stakeholders.
In project management, clarity and foresight are critical. Gantt charts provide a snapshot of the entire project lifecycle, making it easier to anticipate delays and adjust schedules proactively. They also help in coordinating tasks that must occur sequentially or concurrently, ensuring smoother workflow.
While there are many software options available, the universal accessibility of Excel makes it a preferred platform for many teams. Excel’s flexibility allows customization to fit unique project needs, making it an indispensable tool for project managers who want a tailored yet professional Gantt chart.
Microsoft Project is a robust project management tool with advanced features, but it comes with a steep learning curve and licensing costs. Excel, on the other hand, is widely available, user-friendly, and familiar to most professionals, making it an excellent alternative for creating Gantt charts.
Excel allows users to customize the layout, colors, and data inputs without being restricted by predefined templates. This flexibility means you can design Gantt charts that align with your project’s specific requirements and branding, something that can be limited in Microsoft Project.
Additionally, Excel’s integration with other Microsoft Office tools enables seamless data sharing and reporting. The ability to use formulas and conditional formatting in Excel enhances the functionality of Gantt charts, allowing for automated updates and dynamic visual cues that keep your project timeline accurate and visually appealing.
Start by setting up your project data in a table format. List all tasks in one column, along with their start dates and durations. This foundational step is crucial for organizing your project timeline logically and clearly.
Next, insert a stacked bar chart based on your data. Use the start dates as the first data series and durations as the second. The start dates will be formatted to be invisible, allowing the durations to appear as the visible bars representing task timelines.
After inserting the chart, customize the horizontal axis to display dates correctly. Adjust the minimum and maximum bounds to cover your project duration. Finally, format the bars, colors, and labels to enhance readability, making your Gantt chart not only functional but visually similar to Microsoft Project.
To make your Gantt chart stand out, use conditional formatting to highlight critical tasks or milestones. For example, tasks approaching deadlines can be colored red, while completed tasks can be shaded green. This visual differentiation helps stakeholders quickly assess project status.
Incorporate task dependencies by adding arrows or connectors manually or through shapes. While Excel doesn’t have native dependency tracking like Microsoft Project, creative use of shapes and annotations can simulate this functionality effectively.
Adjust the timescale to fit the project scope—whether it’s days, weeks, or months. This flexibility allows you to zoom in on detailed phases or zoom out for an overview. Also, consider adding gridlines and task labels directly on the bars to improve clarity and ease of interpretation.
Leverage Excel formulas to automate date calculations. For instance, use formulas to calculate end dates based on start dates and durations, or to flag overdue tasks automatically. This reduces manual updates and errors.
Use named ranges and dynamic tables to keep your Gantt chart scalable. When you add or remove tasks, the chart updates automatically, saving time and maintaining accuracy throughout the project lifecycle.
Consider using VBA macros for repetitive tasks such as formatting or updating progress bars. While this requires some programming knowledge, it can significantly enhance efficiency and enable features closer to Microsoft Project’s automation capabilities.
One common challenge is managing large projects with many tasks, which can clutter the chart and make it hard to read. To address this, group related tasks into phases or use filters to focus on specific sections of the project.
Another issue is maintaining accuracy when updating timelines. To prevent errors, link your data inputs directly to the chart through formulas and avoid manual adjustments to the chart elements themselves.
Visual limitations can also be a concern, as Excel doesn’t offer built-in Gantt chart templates with interactive features. Overcome this by customizing charts with shapes, colors, and annotations, and by exploring third-party Excel templates designed specifically for project management.
Excel Gantt charts can complement other project management software by serving as a lightweight, easily shareable visualization. Export your Excel chart as a PDF or image to include in reports or presentations for stakeholders who may not have access to specialized software.
For teams using collaboration platforms like Microsoft Teams or SharePoint, embed your Excel workbook so team members can view and update the Gantt chart in real time. This integration enhances transparency and keeps everyone aligned on project status.
Additionally, data from Excel Gantt charts can be imported into tools like Power BI for advanced analytics and dashboard creation. This combination allows project managers to track progress visually while leveraging powerful reporting capabilities.
Regularly update your project data to reflect actual progress. This practice ensures your Gantt chart remains an accurate reflection of the project timeline and helps identify any deviations early.
Keep your data organized and consistent. Use standardized date formats, consistent task naming conventions, and clear duration units. Clean data reduces confusion and errors when updating the chart or sharing it with others.
Finally, back up your Excel files and document any customizations or formulas used. This documentation aids in troubleshooting and enables other team members to understand and maintain the Gantt chart if needed.
Creating a Gantt chart in Excel that rivals the look and functionality of Microsoft Project is entirely achievable with the right approach. By understanding the fundamentals of Gantt charts and leveraging Excel’s powerful features, project managers can design clear, dynamic timelines tailored to their projects. While Excel lacks some of the advanced automation of specialized software, its accessibility, flexibility, and customization options make it an invaluable tool for project visualization. With the techniques and best practices outlined in this guide, you can confidently build and maintain Gantt charts that enhance your project management effectiveness and team collaboration.
Keep reading
Video
Construction project management is a complex discipline that involves coordinating multiple stakeholders...
Video
In today’s fast-paced work environment, effective project management tools are essential for team collab...
Video
Project management is a dynamic and critical discipline that requires a blend of technical expertise, le...
TAMFIS NIG LTD
Electrical and instrumentation engineering, bid preparation and consulting, IT and software.