Derivation of embryonic stem cells across avian species

Main
Embryonic stem (ES) cells derived from mice and rats can be maintained in culture indefinitely while retaining the ability to contribute to chimera formation and transmit through the germline5,6,7,8. This property has enabled us to generate numerous genetically modified animals, substantially advancing our understanding of biology in various aspects. However, attempts to establish chimeric and germline-competent ES cell lines from species other than rodents have, thus far, proved unsuccessful.
Blastodermal cells isolated from freshly laid chicken eggs (EGK.X stage) can contribute to both somatic and germline lineages when reintroduced into EGK.X-stage chicken embryos, indicating that the chicken blastoderm contains germline-competent pluripotent cells9. ES cell-like cell lines have been previously established from chicken blastodermal cells; however, these cells tend to lose their ability to form chimeras and transmit through the germline after prolonged culture10,11,12,13. This has led to the prevailing hypothesis that germline specification in birds may be predetermined by maternal inheritance and cannot be induced from epiblast cells or ES cells derived from them14.
It is worth noting that primordial germ cells (PGCs), the progenitors of the gamete lineage, have emerged as a focal point in avian reproductive biology due to their unique role in preserving germline integrity. Unlike their mammalian counterparts, avian PGCs transiently circulate in the bloodstream during early embryogenesis, allowing for their isolation at well-defined developmental stages (Hamburger–Hamilton stages 14–16). Pioneering studies in chickens have led to the development of in vitro culture systems that support long-term propagation of PGCs under conditions both with and without serum and feeders, while retaining germline competency15,16. These advances have established the utility of avian PGCs for genetic conservation, biodiversity preservation and transgenesis, particularly for applications such as avian bioreactors and genome-edited poultry models. However, substantial limitations remain. Despite decades of effort, reliable PGC propagation is largely restricted to chickens, with only limited success in other avian species17. In contrast to PGCs, ES cell derivation may be more readily adaptable across diverse avian species. Overcoming species barriers using ES cells may permit applications across diverse avian populations, including endangered species, nonmodel avian species with limited embryo availability and other economically important birds. Furthermore, the capacity of ES cells to differentiate into both germline and somatic lineages broadens their use in basic biological studies and commercial applications such as cultivated meat production. As such, pluripotent or ES cells retain complementary value for germline preservation, offering greater flexibility and scalability, despite differences in differentiation potential.
Recent studies on mouse pluripotent stem cells have revealed the existence of multiple pluripotent states18. Even pluripotent cells derived from closely related developmental stages can exhibit distinct responses to signaling pathways that govern self-renewal18. The precise pluripotent state of avian blastodermal cells remains elusive in comparison to mammals. Nonetheless, it is well established that key transcription factors and signaling pathways crucial for early development and lineage specification are often conserved across diverse animal species, including birds and mammals19,20,21,22,23.
Given this evolutionary conservation, we hypothesized that, akin to mammalian pluripotent cells, the pluripotent state of avian blastodermal cells can be captured and sustained in vitro under appropriate culture conditions.
Results
Optimizing chicken ES cell culture conditions
To develop culture conditions for deriving chicken ES cells, we isolated blastodermal cells from freshly laid Rhode Island Red (RIR) chicken eggs at the EGK.X stage. We then screened a panel of small molecules, growth factors and cytokines previously shown to support self-renewal in mouse, rat or human pluripotent stem cells (Supplementary Table 1). Morphologically undifferentiated ES cell colonies emerged when the culture medium was supplemented with either the Wnt/β-catenin signaling inhibitor IWR-1 or the protein kinase C (PKC) inhibitor Gö6983 (Fig. 1a). Similar effects were observed with other Wnt and PKC inhibitors (Extended Data Fig. 1a). Notably, the combination of IWR-1 and Gö6983 produced a synergistic effect in promoting self-renewal of chicken ES cells (Extended Data Fig. 1b). ES cells derived in the presence of IWR-1 and Gö6983 expressed Nanog messenger RNA (mRNA), a key pluripotency marker24,25 (Extended Data Fig. 1c). However, chicken ES cells began to differentiate on passaging, and could not be maintained beyond two passages in the presence of IWR-1, Gö6983 or both (Extended Data Fig. 1d).

aRepresentative images of chicken blastodermal cells cultured in the indicated conditions for 3 days. n = 5 independent experiments. Scale bars, 50 μm. bRepresentative images of chicken ES cells maintained in IWR-1 + Gö6983 + 3% yolk from unfertilized egg (Yolk/2i) at passage 35 (left panel, scale bar, 100 μm). The right panel provides a zoomed-in view of the dotted area from the left panel image (scale bar, 50 μm). n = 5 independent experiments. cSchematic illustrating the methodology employed to identify the active component(s) within egg yolk that facilitates chicken ES cell self-renewal. The designation ‘30–80p’ refers to precipitates obtained at 30–80% saturation of ammonium sulfate. dSDS–PAGE analysis of various fractions obtained from the ammonium sulfate precipitates. Whole and yolk plasma mixtures were within the 50 kDa to 100 kDa range. White dotted squares highlight the regions of the gels that were excised for mass-spectrometry analysis. n = 2 independent experiments. eA representative image of RIR chicken ES cells maintained in OT/2i at passage 25 (left panel). The right panel provides a zoomed-in view of the dotted area from the image in the left panel. n = 10 independent experiments. Scale bars, 50 μm. MWCO, molecular-weight cutoff. Illustrations in c created using BioRender.com.
Full size image
We observed that chicken ES cells exhibited improved growth when a larger amount of egg yolk was carried over during embryo isolation. Moreover, ES cells retained their undifferentiation state for up to 2 weeks of initial plating when the culture medium, which contained residual yolk, was left unchanged and cells were not passaged (Extended Data Fig. 1e). This observation led us to speculate that egg yolk might contain crucial component(s) for promoting chicken ES cell self-renewal. Indeed, by supplementing the culture medium with yolk in combination with IWR-1, and Gö6983 (referred to as Yolk/2i), we were able to continuously passage chicken ES cells while maintaining their undifferentiated morphology (Fig. 1b). Notably, both fertilized and unfertilized egg yolks supported chicken ES cell self-renewal equally well (Fig. 1b and Extended Data Fig. 1f). The pluripotent identity of the expanded chicken ES cells was confirmed by high expression of Nanog mRNA, which was rapidly downregulated upon withdrawal of the self-renewal cocktail (Extended Data Fig. 1g).
Next, we aimed to identify the self-renewal-promoting component(s) within the yolk using the experimental strategy outlined in Fig. 1c. Initially, we fractionated the yolk into sedimented granules and plasma. Our results indicated that the self-renewal-promoting effect was attributed to the component(s) present in the plasma rather than the granules (Extended Data Fig. 2a). We then used molecular-weight cutoff membrane filters to fractionate the plasma into three fractions: <50 kDa, 50–100 kDa and>100 kDa. Only the 50–100-kDa fraction retained the self-renewal-promoting effect (Extended Data Fig. 2a). Further fractionation of the 50–100-kDa fraction using ammonium sulfate precipitation revealed that the protein precipitates recovered at different ammonium sulfate concentrations exhibited distinct effects on maintaining chicken ES cells. Notably, the precipitates obtained at 80% saturation of ammonium sulfate (80p) exerted the strongest effect in preserving the undifferentiated state of chicken ES cells (Extended Data Fig. 2b). SDS–PAGE analysis of the 80p fraction revealed an enriched band with an approximate size of ~75 kDa (Fig. 1d). Subsequent mass-spectrometry analysis confirmed the presence of ovotransferrin in the 80p fraction, which was identified as the protein responsible for the self-renewal-promoting effect (Extended Data Fig. 2c and Supplementary Table 2). Note that minor factors observed in the 80% fraction, such as vitellogenin, serum albumin and ovomucoid, were present at high levels in the 50% and 70% fractions, as indicated by the trend box (Extended Data Fig. 2c) and Supplementary Table 2. Neither of these fractions supported self-renewal (Extended Data Fig. 2b).
Furthermore, we successfully derived and maintained chicken ES cells from multiple breeds in the presence of ovotransferrin, IWR-1 and Gö6983 (hereafter referred to as OT/2i) (Fig. 1e and Extended Data Fig. 2d). These findings indicate that ovotransferrin is the primary self-renewal-promoting component in egg yolk. The function of ovotransferrin in the OT/2i condition could not be substituted by its mammalian ortholog, highlighting a species-specific role for ovotransferrin in supporting chicken ES cell self-renewal and survival16,26,27 (Extended Data Fig. 2e,f). Chicken ES cells cultured in OT/2i retained alkaline phosphatase activity, although at a lower intensity than that observed in mouse ES cells (Extended Data Fig. 2g). Notably, the withdrawal of either IWR-1 or Gö6983 resulted in a rapid loss of self-renewal capacity in vitro, suggesting that all components of the OT/2i cocktail are essential for the successful establishment and maintenance of chicken ES cells (Extended Data Fig. 2h).
Optimizing culture conditions for ES cells across avian species
We investigated the feasibility of deriving ES cells from various avian species using the OT/2i culture system. Blastodermal cells from fertilized eggs of pheasant, duck and turkey were cultured in OT/2i. While ES cell colonies emerged within 2–3 days, they rapidly differentiated, primarily into beating cardiomyocytes (Extended Data Fig. 3a and Supplementary Video 1). SB431542, a potent and selective inhibitor of activin receptor-like kinases −4, −5 and −7, previously shown to block cardiomyocyte differentiation28effectively prevented this differentiation a nd maintained pheasant, duck and turkey ES cells in an undifferentiated state (Extended Data Fig. 3b–d). However, long-term self-renewal of quail ES cells could not be sustained using OT/2i + SB431542 (hereafter referred to as OT/3i). For quail ES cell maintenance, the addition of chicken leukemia inhibitory factor (LIF) was essential (Extended Data Fig. 3e,f). The self-renewal-promoting effect of chicken LIF on quail ES cells could not be replicated using human LIF, likely due to the limited sequence homology between avian and mammalian LIF, as previously reported29 (Extended Data Fig. 3e).
While the combination of OT/3i and chicken LIF (referred to as OT/3i/chLIF) was sufficient for the derivation and maintenance of ES cells from chicken, quail, goose, duck, turkey, pheasant and peafowl, we found that ostrich ES cells could be derived and maintained in OT/3i, and that the addition of chLIF induced differentiation (Fig. 2a,b and Extended Data Fig. 3g,h). Two ES cell lines, one from chicken and one from quail, established in OT/3i/chLIF, were subjected to karyotype analysis. G-banding revealed that both lines were predominantly diploid (50 out of 50 cells for chicken ES cells and 44 out of 48 cells for quail ES cells), with approximately 10% of the quail cells exhibiting haploid or near-haploid karyotypes (Extended Data Fig. 3i,j).
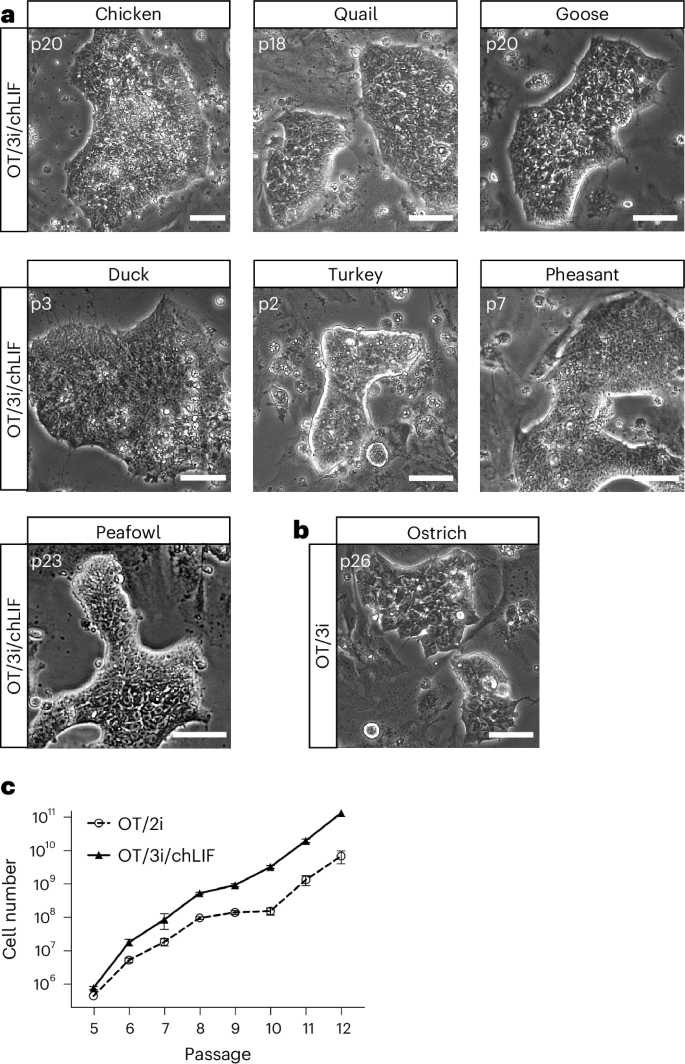
aRepresentative images of ES cells derived from multiple avian species in OT/3i/chLIF. n = 3 independent experiments. Scale bars, 50 μm. bA representative image of ostrich ES cells derived and maintained in OT/3i. n = 5 independent experiments. Scale bar, 50 μm. cGrowth curves of a representative chicken ES cell line (RIR41) cultured in OT/2i or OT/3i/chLIF. Data represent the mean ± s.d. of three biological replicates.
Full size image
Next, we compared the efficiency of chicken ES cell derivation and maintenance between OT/3i/chLIF and OT/2i. Both conditions successfully facilitated single-embryo derivation, resulting in eight stable ES cell lines from nine embryos in either condition and supported long-term maintenance of chicken ES cells. Notably, chicken ES cells propagated more robustly in OT/3i/chLIF than in OT/2i, suggesting a synergistic effect of SB431542 and chicken LIF with IWR-1 and Gö6983 in promoting chicken ES cell self-renewal (Fig. 2c). It is worth noting that some established chicken ES cell lines occasionally lost their characteristic colony morphology, defined by tightly packed, uniform cells, and became prone to differentiation. This phenotype typically occurred after extended culture (>20 passages) and when cells became overly confluent before passaging (Extended Data Fig. 3k). Similar to observations in stem cell cultures from other species, high cell density may create a local microenvironment that promotes sustained MAPK (MAP-kinase) signaling via combined autocrine secretion, paracrine support and extracellular matrix stabilization30,31. To address this, we tested whether inhibition of MAPK signaling, which is not directly targeted in the OT/3i/chLIF condition, could help stabilize clonal morphology during long-term culture. We found that the addition of CP-673451, a selective inhibitor of platelet-derived growth factor receptor, effectively prevented spontaneous differentiation and stabilized long-term in vitro maintenance of chicken ES cells (Extended Data Fig. 3k). Furthermore, CP-673451 improved the clonogenic efficiency of chicken ES cells (Extended Data Fig. 3l).
In the chicken embryo, a subset of epiblast cells retains pluripotency during primitive streak formation (HH2 stage)32. To determine whether these cells could be maintained under chicken ES cell culture conditions, we isolated and cultured cells from HH2-5 embryos in OT/2i, OT/3i or OT/3i/chLIF. However, all cells underwent differentiation (Extended Data Fig. 3m), suggesting that the EGK.X stage represents a restricted developmental window for successful derivation of chicken ES cells using the described conditions.
Chicken ES cells derived in OT/3i/chLIF are pluripotent
Chicken ES cells exhibit heterogeneous expression of pluripotency-associated surface markers, including stage-specific embryonic antigen-1 (SSEA-1) and epithelial membrane antigen-1, across individual colonies (Extended Data Fig. 4a). This pattern is consistent with previously reported characteristics of pluripotent stem cells in some nonmammalian systems33. To further assess the pluripotency of chicken ES cells, we induced their differentiation through embryoid body (EB) formation, a process during which ES cells spontaneously differentiate into derivatives of all three germ layers34. Quantitative PCR with reverse transcription (RT–qPCR) analysis revealed significant downregulation of the core pluripotency genes Nanog, Pou5f3 and Sall4 on EB formation24,25,35,36,37,38along with upregulation of lineage-specific markers for ectoderm, mesoderm and endoderm (Extended Data Fig. 4b). Immunostaining further confirmed the differentiation of chicken ES cells into all three germ layers, as evidenced by the presence of TUJ1-positive (ectoderm), MHC-positive (mesoderm) and GATA4-positive (endoderm) cells (Fig. 3a). In addition, Oil Red O staining verified the differentiation of chicken ES cells into adipocytes (mesoderm) (Extended Data Fig. 4c). Together, these results demonstrate that chicken ES cells are pluripotent and possess the capacity to differentiate into all three germ layers in vitro.
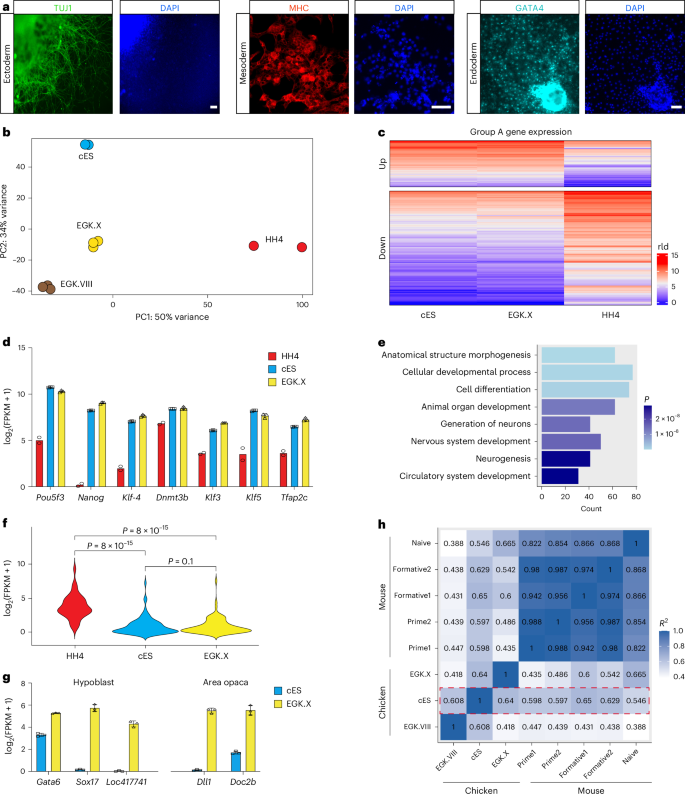
aImmunostaining of cells differentiated from chicken ES cells. n = 3 independent experiments. Scale bars, 50 μm. bPrincipal component analysis (PCA) of RNA-seq data obtained from chicken ES cells (cES) and cells isolated from EGK.VIII, EGK.X and HH4 stage chicken embryos. Three biological replicates were performed for ES cells, EGK.VIII and EGK.X embryos, while two biological replicates were conducted for HH4 embryos. Data from EGK.VIII embryos were obtained from accession number GSE86592, and HH4 data were retrieved from GenBank at SRX893876. cHeatmap analysis showing the differential gene expression profiles among chicken ES cells and cells isolated from EGK.X and HH4 stage chicken embryos. rld, regularized log transformation. dFragments per kilobase of transcript per million mapped reads (FPKM) values of the pluripotency genes obtained by RNA-seq analysis of chicken ES cells and cells isolated from EGK.X and HH4 stage embryos. Data represent mean ± s.d. of three biological replicates for chicken ES cells and EGK.X embryos and mean of two biological replicates for HH4 embryos. eGene ontology (GO) analysis of the group A downregulated genes (c) in chicken ES cells as compared to cells in HH4 embryos. Group A downregulated genes were expressed at a lower level in both chicken ES cells and EGK.X embryos compared to HH4 embryos. The significance was determined using a hypergeometric test. fViolin plots from RNA-seq data showing the expression of differentiation-related genes (from the gene ontology term cluster). Statistical analysis was performed using the Wilcoxon test. gFPKM values of hypoblast and area opaca markers obtained from RNA-seq analysis of chicken ES cells and cells isolated from EGK.X embryos. Error bars represent s.d. Data represent mean ± s.d. of three biological replicates. hTranscriptome correlation analysis across species. Mouse data were from ref. 64 (GSE131556). Red dotted box highlights the comparison of chicken ES cells with various primary chicken cells or mouse pluripotent stem cells.
Full size image
To further characterize the cellular identity, we conducted RNA sequencing (RNA-seq) analysis on OT/3i/chLIF chicken ES cells. Unbiased principal component analysis of bulk RNA-seq data from chicken ES cells, as compared to cells at EGK.VIII, EGK.X and HH4 stages, revealed a close relationship between chicken ES cells and blastodermal cells at the EGK.X stage, from which the ES cells were derived (Fig. 3b, based on PC1). However, notable differences were observed between ES cells and EGK.X cells, resulting in their separation on PC2. As an extra test, we identified signature genes from EGK.I to HH4 stages and performed heatmap analysis, which demonstrated that ES cells and EGK.X cells clustered together and were distinct from cells at other developmental stages (Extended Data Fig. 4d).
Subsequently, we conducted a comprehensive transcriptomic analysis of chicken ES cells, their in ovo counterpart EGK.X cells and HH4 cells at the gastrulation stage. At the whole-transcriptome level, chicken ES cells exhibited a higher linear correlation with EGK.X cells (R = 0.8), compared to HH4 cells (R = 0.73) (Extended Data Fig. 4e). Gene set enrichment analysis further confirmed that the expression of EGK.X signature genes, rather than HH4 signature genes, was significantly upregulated in chicken ES cells (Extended Data Fig. 4f).
By comparing gene expression in chicken ES cells with cells from EGK.X and HH4 embryos, we categorized all genes into three groups: A, B and C (Fig. 3c and Extended Data Fig. 4g). Group A contained 1,386 genes, with 358 upregulated and 1,028 downregulated in both chicken ES cells and EGK.X stage embryos relative to HH4 stage embryos. Within this group, core pluripotency genes, such as Nanog, Pou5f3 and Klf4 were highly expressed in chicken ES cells and EGK.X embryos (Fig. 3d). Gene ontology term enrichment analysis of the downregulated genes in group A revealed numerous differentiation and development-related gene ontology terms, suggesting that the OT/3i/chLIF condition effectively suppressed ES cell differentiation (Fig. 3e,f).
Group B contained 1,046 genes that showed no statistical difference between EGK.X and HH4 stage embryos but were significantly upregulated (384 genes) or downregulated (662 genes) in chicken ES cells. Gene ontology term analysis revealed that the upregulated genes were primarily involved in metabolic processes, suggesting that the differential expression between chicken ES cells and cells from EGK.X and HH4 stage embryos could be partially attributed to the environmental differences between in vitro and in ovo conditions (Extended Data Fig. 4g,h). Group C included the remaining 21,944 genes. Of these, 20,913 showed no statistically significant differences among chicken ES cells, EGK.X and HH4 embryos. The other 1,031 genes were differentially expressed between EGK.X and HH4 stage embryos but showed no significant differences between chicken ES cells and HH4 embryos. However, a gene ontology term analysis of these 1,031 genes did not reveal any statistically significant gene clusters (Padjust < 0.05).
In our bulk RNA-seq experiment, EGK.X embryos were collected in their entirety, comprising not only epiblast cells but also hypoblast cells and cells from the extra-embryonic region (area opaca). To further investigate the identity of chicken ES cells, we analyzed the expression of marker genes specif ic to the hypoblast and area opaca regions in both EGK.X embryos and cultured chicken ES cells39,40. This comparative analysis revealed that chicken ES cells exhibit low expression of markers associated with those two lineages, suggesting that the cultured ES cells closely resemble epiblast cells at the EGK.X stage (Fig. 3g).
In mice, at least three pluripotent states (naive, formative and primed) have been proposed18. To assess the pluripotent state of chicken ES cells, we conducted transcriptome correlation analysis using overlapping gene orthologs between two species and observed that chicken ES cells exhibited a closer resemblance to mouse formative pluripotent stem cells than to mouse naive or primed pluripotent stem cells (Fig. 3h).
In summary, our findings demonstrate that the OT/3i/chLIF condition effectively captures and maintains chicken ES cells in a pluripotent state resembling that of in ovo chicken EGK.X-stage epiblast cells.
Chicken ES cells are amenable to precise genome editing
To assess the genome-editing capability of chicken ES cells, we used a GFP-to-blue fluorescent protein (BFP) conversion assay to quantify CRISPR–Cas9-mediated genome editing via nonhomologous end joining and homology-directed repair41,42. A GFP-positive chicken ES cell line was derived from a transgenic chicken ubiquitously expressing GFP (Roslin Green)43. These cells were electroporated with Cas9 protein, a GFP single-guide RNA, and a single-stranded oligodeoxynucleotide (ssODN) donor to induce GFP-to-BFP knock-in conversion (Extended Data Fig. 5a). Flow cytometry analysis revealed a GFP-to-BFP conversion efficiency (BFP⁺/GFP−) of 9.3%, with an extra 3.7% of cells displaying single-allele conversion (BFP+/GFP+) (Extended Data Fig. 5b). Clonal populations were subsequently established via fluorescence-activated cell sorting and low-density plating, followed by expansion (Extended Data Fig. 5c). Genotypic analysis confirmed precise genome editing consistent with the observed fluorescence profiles (Extended Data Fig. 5d). These findings demonstrate that chicken ES cells are amenable to efficient and precise genome editing, supporting their use as a robust platform for both basic research and biotechnological applications.
Avian ES cells express core pluripotency factors
To characterize the pluripotency identity of avian ES cells beyond chicken, we examined ES cell lines derived from quail, goose and ostrich. Similar to chicken ES cells, these ES cell lines retained alkaline phosphatase activity, although the level and pattern of expression varied among colonies and species (Extended Data Figs. 2g,h, 3f,h and 6a). Quail ES cells demonstrated the capacity for in vitro differentiation into all three germ layers, as evidenced by the expression of TUJ1 (ectoderm), MHC (mesoderm) and GATA4 (endoderm) (Extended Data Fig. 6b). To further explore transcriptional identity, we performed bulk RNA-seq on ES cell lines derived from quail, goose and ostrich, and compared them to chicken ES cells. All four avian ES cell lines expressed high levels of key pluripotency-associated transcription factors, including Nanog or Nanog-like, Lin28a/b and Pou5f3while other Pou family members were not detected (Extended Data Fig. 6c). We also examined the expression of SOX and KLF family genes. Unlike mammalian ES cells, avian ES cells did not express Sox2; instead, Sox3 was consistently expressed in ES cells derived from all four avian species. In addition, Sox4 and Sox11 were coexpressed in quail and goose ES cells. Regarding KLF family genes, avian ES cells predominantly expressed Klf3, Klf5 and KLF6in contrast to the high Klf4 expression observed in mammalian ES cells. Notably, the expression levels of KLF3 / 5/6 varied among the different avian ES cell lines.
Avian ES cells show species-specific responses to LIF signaling
While chicken, quail and goose ES cells exhibited improved self-renewal in the presence of exogenous LIF, ostrich ES cells responded differently: LIF exposure induced differentiation, potentially toward trophectoderm lineages (Extended Data Fig. 3e–h). Transcriptomic profiling revealed that ostrich ES cells uniquely expressed elevated levels of LIF receptor (LIFR) and GP130 (IL6ST) compared to other avian ES cell lines (Extended Data Fig. 6d). This observation aligns with previous mechanistic studies in mouse ES cells, where STAT3 signaling functions as a dose-sensitive ‘rheostat’ rather than a binary switch in regulating cell fate44. Together, these findings suggest that while ES cells derived from diverse avian species share core pluripotent features with chicken ES cells, they also display species-specific regulatory response, particularly in their sensitivity to the LIF/STAT3 signaling pathway.
Chicken ES cells derived in OT/3i/chLIF are chimera-competent
The ability to contribute to chimera formation is a defining characteristic of authentic ES cells. To investigate whether OT/3i/chLIF chicken ES cells possess this capacity, we implanted them onto ex ovo incubated chicken embryos (Fig. 4a). GFP-positive chicken ES cells efficiently integrated into the developing chicken EGK.X-stage embryos, leading to the formation of chimeric embryos (Fig. 4b,c). In contrast, chicken ES cells implanted into HH4 stage embryos failed to integrate (Fig. 4d), highlighting the importance of matching developmental stages between donor cells and recipient embryos45,46.
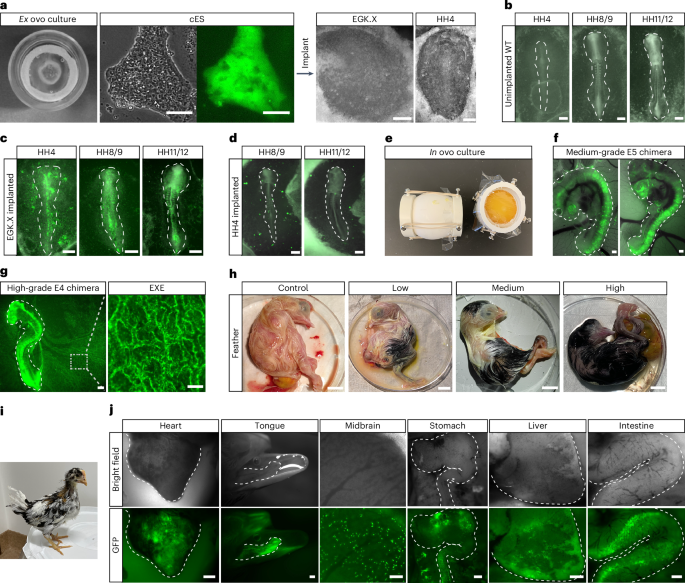
aGFP-labeled chicken ES cells were implanted onto ex ovo cultured EGK.X or HH4 chicken embryos. Scale bars, 100 μm (cES cells), and 400 μm (EGK.X and HH4 embryos). bRepresentative images showing HH4-HH11/12 stage embryos developed from ex ovo cultured chicken EGK.X embryos without the implantation of chicken ES cells. Scale bars, 400 μm. cRepresentative images showing HH4-HH11/12 stage embryos developed from ex ovo cultured chicken EGK.X embryos implanted with GFP-positive chicken ES cells. Scale bars, 400 μm. dRepresentative images showing HH8/9 and HH11/12 stage embryos developed from ex ovo cultured chicken HH4 embryos implanted with GFP-positive chicken ES cells. Scale bars, 400 μm. eImage of the surrogate open-shell system for in ovo chimeric embryo development. f,gChimeras generated by injecting GFP-positive chicken ES cells into EGK.X-stage chicken embryos: medium-grade E5 chimera (f) and high-grade E4 chimera (g). Scale bars, 400 μm. EXE, extra-embryonic blood vessels (scale bar, 100 μm). hImages showing control, low-grade, medium-grade and high-grade E20 chimeras generated by injecting RIR chicken ES cells into EGK.X White Leghorn chicken embryos. Scale bar, 10 mm. iA chimeric chicken with black feathers from donor ES cells derived from RIR at 31 days old posthatch. Recipient embryo, White Leghorn. jImages showing GFP-positive cells in the indicated organs of chimeras generated by injecting GFP-positive chicken ES cells into EGK.X chicken embryos. Heart (E13, scale bar, 1 mm), tongue (E20, scale bar, 1 mm), midbrain (E8, scale bar, 100 μm), stomach (E7, scale bar, 400 μm), liver (E21, scale bar, 400 μm) and intestine (E19, scale bar, 400 μm). Chimeras generated are from 1 representative experiment of more than 5 experiments performed in a–dfor ex ovo, and more than 100 experiments performed in e–jfor in ovo.
Full size image
While the ex ovo culture system provided a straightforward means to assess the chimera formation potential of chicken ES cells, the in ovo system was necessary for long-term monitoring of donor cell development. We used the surrogate open-shell system to observe chimeric embryo development until hatching47 (Fig. 4e and Extended Data Fig. 7a). GFP-positive chicken ES cells were injected into the subgerminal cavity of EGK.X-stage chicken embryos. Embryonic development and the distribution of GFP-positive cells were monitored through a window sealed with plastic film (Extended Data Fig. 7b). Chicken ES cells contributed to multiple lineages within the chicken embryos in ovo (Extended Data Fig. 7c and Supplementary Video 2). However, the overall level of in ovo chimerism was relatively low compared to ex ovo chimeras.
Previous studies demonstrated that sublethal irradiation of recipient chicken embryos can enhance the contribution of injected blastodermal cells48. Applying this method, irradiation of recipient embryos at 500–550 cGy (rad) before chicken ES cell injection increased the extent of chimerism without substantially compromising embryo viability (Fig. 4f,g and Extended Data Fig. 7d). Long-term cultured chicken ES cells, which included 60 passages on feeders and 15 passages under feeder-free conditions, retained their capacity for chimera formation (Extended Data Fig. 7e). Immunostaining for lineage markers in chimeric embryos demonstrated donor cell contribution to neural tube formation, indicated by SOX2 expression, and to the mesoderm, marked by Brachyury expression (Extended Data Fig. 7f). Notably, chicken ES cells gave rise to both somatic and extra-embryonic cells in the chimeric embryos (Fig. 4g and Supplementary Videos 3 and 4), a feature distinct from mouse ES cells.
To assess the sustainability of functional engraftment over time, we analyzed chimeric embryos at later developmental stages (embryonic day 8–21 and posthatching). Visible coat color chimeras were successfully obtained, consistent with the chimera rate determined by GFP coverage at E4 (Fig. 4h,i). Furthermore, we detected donor cell contribution to organs from multiple germ layers (Fig. 4j). A summary of the avian ES cell–embryo chimeras is provided in Supplementary Table 3, and the ratios of chimerism in chicken ES cell–chicken embryo chimeras generated via nonirradiation and irradiation methods are provided in Extended Data Fig. 7d. Collectively, the ex ovo and in ovo experiments demonstrated the efficient integration of chicken ES cells into embryonic development, contributing to both somatic and extra-embryonic cell lineages.
Chicken ES cells contribute to feather patterning in chimeras
To further monitor the development of engrafted chicken ES cells over the long-term, embryos with feather color chimerism were hatched and raised for observation (Fig. 4i and Extended Data Fig. 8a). In adult feathers, the feather follicle undergoes cyclic renewal, and the pigment patterns depend on the follicle melanocyte stem cells49. The White Leghorn chicken strain has a mutation that affects melanocytes’ ability to process melanosome properly, resulting in an apigmented phenotype50. We investigated whether chicken ES cells derived from RIR could contribute to the functional melanocyte lineage and exhibit pigmentations in the chimera. Contour feather follicles were collected from adult chimeric chickens and compared to feathers from adult White Leghorn and RIR chickens (Extended Data Fig. 8b–d). Par affin sections were stained with hematoxylin and eosin, revealing normal feather follicle development in chimeric chickens (Extended Data Fig. 8e–g). Bright views of feather follicles displayed pigmented chimeric feathers compared to apigmented White Leghorn feathers (Extended Data Fig. 8h–j). Staining for microphthalmia-associated transcription factor (MITF), a marker for melanocyte progenitor cells51showed MITF expression in RIR and chimeric chicken feathers, while White Leghorn chicken feathers were MITF-negative (Extended Data Fig. 8k–m). In addition, chimeric chicken feathers were GFP-positive (Extended Data Fig. 8n). All together, these findings indicate that chicken ES cells derived from RIR contributed to the generation of melanocyte progenitor cells inside the recipient White Leghorn feather follicles, resulting in feather pigmentation in chimeric chickens.
Avian ES cells contribute to intra- and interspecies chimeras
To evaluate the developmental potential of ES cells derived from other avian species, we generated quail and goose ES cells that constitutively expressed GFP (Fig. 5a,b). Given that quail-chick chimeras can be created by injecting quail blastodermal cells into chicken embryos52we hypothesized that this interspecies chimera system could be used to assess the chimera competency of avian ES cells. GFP-positive quail and goose ES cells were implanted onto ex ovo incubated EGK.X-stage chicken embryos, resulting in the successful integration of donor cells into the recipient chicken embryos (Fig. 5a,b).
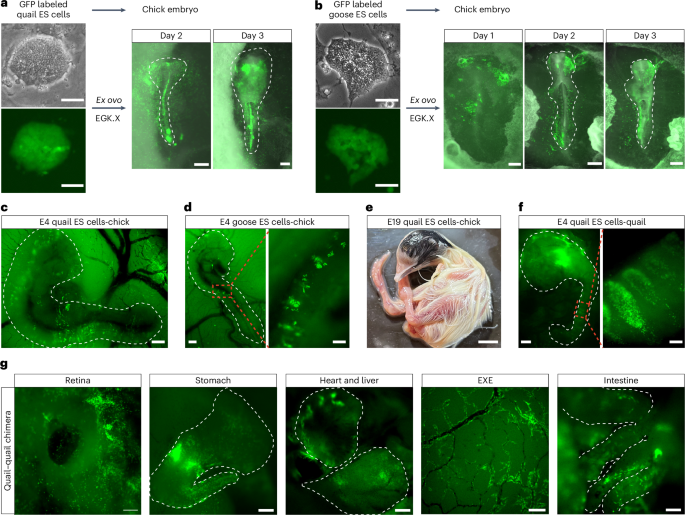
aGFP-labeled quail ES cells (left panel, scale bars, 50 μm) were implanted onto EGK.X chicken embryos, and the contribution of quail ES cell-derived cells in the chicken embryos was traced ex ovo for 3 days. Embryo scale bars, 220 μm. bGFP-labeled goose ES cells (left panel, scale bars, 50 μm) were implanted onto EGK.X chicken embryos, and the contribution of goose ES cell-derived cells in the chicken embryos was traced ex ovo for 3 days. Embryo scale bars, 220 μm. c,dRepresentative images showing ES cell–chicken embryo chimeras generated by in ovo injection of GFP-labeled quail (cscale bar, 400 μm) or goose (dscale bars, 400 μm, left; 100 μm, right) ES cells into the subgerminal cavity of EGK.X chicken embryos. eAn E19 quail ES cell–chicken embryo chimera showing the contribution of quail ES cells (black feathers) in the chimera. Scale bar, 10 mm. fImages showing a quail ES cell–quail embryo chimera generated by injecting GFP-labeled quail ES cells into the subgerminal cavity of an EGK.X quail embryo. Scale bars, 400 μm (left), 100 μm (right). gImages showing GFP-labeled quail ES cell-derived cells inside the indicated quail organs. E6 retina, scale bar, 100 μm; E8 stomach, scale bar, 400 μm; E8 heart (top) and liver (bottom), scale bar, 400 μm; E8 extra-embryonic blood vessels (EXE), scale bar, 400 μm; E8 intestine, scale bar, 100 μm. Chimeras generated are from 1 representative experiment of more than 3 experiments performed in a–bfor ex ovo, and more than 10 experiments performed in c–gfor in ovo.
Full size image
To further confirm the chimera formation capacity of avian ES cells, we injected GFP-positive quail and goose ES cells into chicken embryos in ovo. Both quail and goose ES cells contributed to chimera formation within developing chicken embryos (Fig. 5c,d). Notably, donor ES cells from quail and goose participated in the somitogenesis process in recipient chicken embryos. The stable integration of quail ES cells within chicken embryos was evidenced by coat color chimerism, with black feathers from donor quail cells appearing on an apigmented White Leghorn chicken embryo (Fig. 5e). In addition, GFP-positive donor cells from quail and goose were found in the blood circulation, indicating their contribution to the blood lineage in the recipient chicken embryos (Supplementary Videos 5 and 6).
Finally, substantial integration was observed when quail ES cells were injected into the subgerminal cavity of quail embryos in ovo, with donor cells contributing to organs derived from multiple germ layers (Fig. 5f,g and Supplementary Video 7). These findings demonstrate that quail and goose ES cells can efficiently contribute to chimera formation.
Avian ES cells can differentiate into germ cells
Next, we evaluated the germ cell differentiation potential of chicken ES cells. We generated EBs from chicken ES cells and examined the expression of germ cell markers, including Dazl, Cvh, Cxcr4, Sycp3 and Stra8 (ref. 53). The relative expression levels of these markers significantly increased in day-4 EBs compared to undifferentiated chicken ES cells, but subsequently decreased in day-8 EBs, likely due to the expansion of somatic cells within the EBs (Fig. 6a). This peak in germ cell marker expression identified day 4 as an optimal time point to further investigate germ cell formation in EBs.
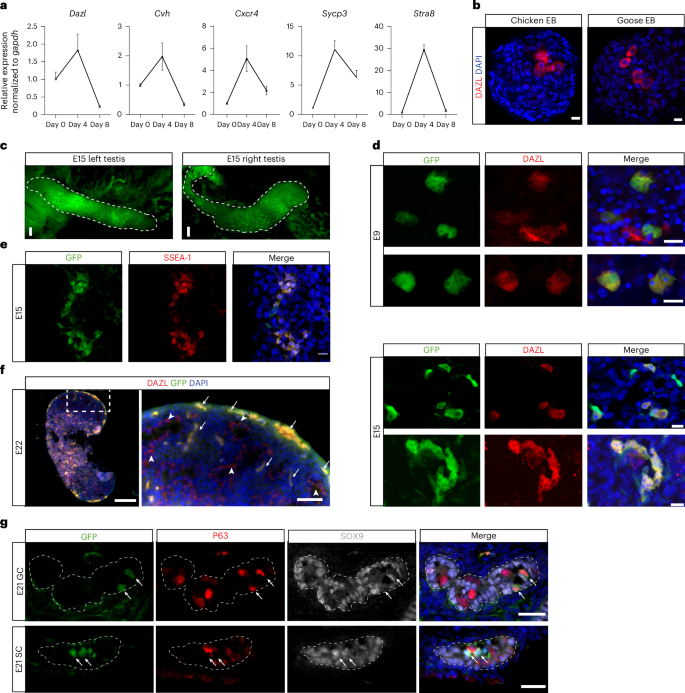
aRT–qPCR analysis of the expression of germ cell markers in chicken ES cells (day 0) and during EB differentiation. Data represent mean ± s.d. of three biological replicates. bImmunofluorescence staining of DAZL in day-3 EBs formed from chicken or goose ES cells. n = 3 independent experiments. Scale bars, 10 μm. cGFP fluorescence images showing the testes dissected from an E15 high-grade chimera generated by injecting GFP-labeled chicken ES cells into the subgerminal cavity of an EGK.X chicken embryo. Scale bars, 50 μm. dImages showing GFP and DAZL double staining of tissue sections from E9 and E15 testes dissected from chimeras generated by injecting GFP-labeled chicken ES cells into the subgerminal cavity of EGK.X chicken embryos. Scale bars, 10 μm. eImages showing GFP and SSEA-1 double staining of tissue sections from an E15 gonad dissected from a chimera generated by injecting GFP-labeled chicken ES cells into the subgerminal cavity of an EGK.X chicken embryo. Scale bars, 10 μm. fImmunostaining of E22 testis sections from a chimera generated by injecting GFP-labeled chicken ES cells into the subgerminal cavity of an EGK.X-stage chicken embryo. The right panel shows a zoom-in view of the boxed area in the left panel. Arrows indicate GFP and DAZL double-positive cells; arrowheads indicate GFP-negative/DAZL-positive cells. Scale bars, left, 200 µm, right, 50 µm. gImages showing GFP/P63/SOX9 triple staining of tissue sections from E21 testes dissected from chimeras generated by injecting GFP-labeled chicken ES cells into the subgerminal cavity of EGK.X chicken embryos. Arrows indicate GFP+/P63+/SOX9− germ cells (GC) in the top row and GFP+/P63−/SOX9+ Sertoli cells (SC) in the bottom row. Scale bars, 20 μm. Chimeras shown in c–g are from one representative experiment out of five performed.
Full size image
To further investigate germ cell differentiation, we performed immunofluorescence staining for the PGC marker DAZL in both undifferentiated chicken ES cells and differentiating EBs. DAZL expression was not detected in chicken ES cells, but a subset of cells (1–3%) in day-3–4 EBs stained positive for DAZL, including those derived from goose ES cells (Fig. 6b, Extended Data Fig. 9a and Supplementary Video 8). Immunostaining of cultured goose ES cells showed a consistent, albeit very low percentage (0.01–0.14%, n = 7) of DAZL-positive cells without the need of EB formation. To determine whether these DAZL-positive cells originated from cultured ES cells or residual PGCs present in the initial culture, goose ES cells were seeded at low density to allow clonal expansion. Individual colonies were picked and expanded to establish clonal lines (n = 4). DAZL-positive cells were still detected in all clonal lines, confirming that cultured goose ES cells possess the capacity to generate DAZL-positive cells in vitro (Extended Data Fig. 9b). To further characterize ES cell-derived PGC-like cells, we designed a probe targeting Cvh for in situ hybridization chain reaction and validated its specificity in chicken HH8 embryo (Extended Data Fig. 9c). Using this probe, we also found Cvh-positive cells inside the chicken EBs (Extended Data Fig. 9d).
To examine germline contribution in ovo, we injected male GFP-positive chicken ES cells into EGK.X-stage chicken embryos pretreated with 500–550-cGy irradiation. Sublethal irradiation has been shown to increase the germline transmission rate of donor PGCs in chickens by reducing the number of endogenous PGCs54. All subsequent analysis of donor ES cell-derived germ cells were performed exclusively using male-to-male donor–recipient pairings. GFP-positive donor cells were present in the gonads of chicken embryos injected with chicken ES cells, particularly in high-grade chimeras (Fig. 6c).
We analyzed the presence of ES cell-derived germ cells in chimeric embryos at different developmental stages. In E9 chimeric embryos, DAZL-double-positive and GFP-double-positive cells were present in gonads as small clusters consisting of 1–3 cells (Fig. 6d). In E15 and later chimeric embryos, larger clusters of GFP-positive cells that were also positive for DAZL or SSEA-1, another germ cell marker55were found in the gonads (Fig. 6d–f and Extended Data Fig. 9e). In E21 embryos, some PGCs were enclosed within the seminiferous tubules as gonads continued to develop. GFP-positive PGCs, identified by staining with P63, a germ cell marker56could be detected within the tubules alongside endogenous PGCs. Furthermore, some seminiferous tubules contained GFP cells that differentiated into Sertoli cells, as indicated by staining with SOX9 (Fig. 6g).
Multiple chicken ES cell lines were confirmed to contribute to the germline lineage within chicken embryos (Supplementary Table 4). Notably, chicken ES cell lines that failed to differentiate into DAZL-positive cells in vitro were able to give rise to germ cells after transplantation into chicken embryos, suggesting a more favorable germline-inductive environment in ovo compared to the spontaneous differentiation environment in vitro. Qualitative analysis indicated that high-grade chimeras exhibited a substantial proportion of donor-derived PGCs (Fig. 6d,e and Supplementary Table 4). In contrast, donor-derived PGCs were present at low frequencies in mid-grade chimeras and were not observed in low-grade chimeras (Supplementary Table 4). In conclusion, by tracking the germline development of avian ES cells, we demonstrated their competence to adopt a germ cell fate both in vitro and in ovo.
Discussion
This study demonstrates that avian ES cells can be efficiently derived and maintained long-term without losing their pluripotency, including the ability to differentiate into germ cells. The establishment of avian ES cells, coupled with advancements in gene-editing technology57creates a robust platform for generating genetically modified avian species. These results hold promise for applications in developmental biology, the bioreactor industry, poultry and related fields. Moreover, the development of avian ES cell self-renewal conditions opens avenues for conserving endangered species and reviving extinct avian animals in combination with cellular reprogramming technology33,58.
In contrast to mammals, the mode of PGC formation in birds has long been debated14,59. Our study challenges the prevailing notion of maternal specification in chickens, revealing that in vitro expanded chicken ES cells can give rise to PGCs both in vitro and in ovo. Detailed analysis across developmental stages confirmed chicken ES cell-derived PGC identity, revealing a trajectory that mirrors endogenous PGCs. While avian ES cell lines exhibit variable in vitro differentiation capacity into the germline lineage, efficient adoption of a germline fate on in ovo transplantation suggests a promising avenue for generating transgenic avian species.
A limitation of this study was the absence of definitive germline transmission, despite the demonstration of donor ES cells differentiating in ovo to PGCs. This limitation was due to the failure of high-grade chimeras to hatch. Notably, 32 high-grade chimeras developed normally until 3 days prehatching, but none successfully hatched. Strain-specific incompatibility likely contributed to this outcome, where RIR ES cells were injected into White Leghorn recipient embryos. Previous work using blastodermal donor cells demonstrated reduced hatch rates and somatic chimerism using this RIR-White Leghorn combination compared to other donor–recipient pairings (for example, 7.4% hatch rate for RIR versus 33.8% for Barred Plymouth Rock and 56.1% for Green-legged Partridge-like in White Leghorn recipients)60. Our results align with these observations, suggesting that donor–recipient incompatibilities may hinder late embryonic viability in high-grade chimeras. Meanwhile, six low-grade to mid-grade male chimeras were successfully hatched but produced zero donor-derived offspring among 255 fertilized eggs. The absence of donor-derived offspring from these chimeras was consistent with our characterization of chimeric gonads, which indicated an absence of donor-derived PGCs in low-grade chimeras. While these data were not included in the main results due to iteratively evolving methodologies, they are reported here to inform replication efforts. For future experiments, it would be advisable to use genetically tagged donor ES cells injected into recipient embryos of the same strain or more optimally matched strains. This approach is expected to improve the production and viability of high-grade chimeras, a critical step for rigorous assessment of germline transmission. Furthermore, elucidating molecular mechanisms governing ES cell-to-PGC differentiation will be crucial for advancing both our understanding and the practical application of avian germline engineering.
The capture of ES cells across avian species underscores the conserved roles of Wnt and PKC signaling in governing the pluripotency of avian blastodermal cells. However, applying the chicken ES cell self-renewal condition (OT/2i) to other avian species proved ineffective due to subtle differences in cell fate control. Through meticulous adjustments, we identified the self-renewal-promoting effects of SB431542 and chicken LIF, which were initially excluded during the development of the chicken ES cell culture condition. Unlike ES cells from other avian species, ostrich ES cells rapidly underwent differentiation (potentially toward the trophectoderm lineage) in response to chicken LIF. Cross-species RNA-seq analysis revealed elevated expression of both LIF receptor and GP130 (IL6ST) in ostrich ES cells compared to chicken, quail and goose ES cells (Extended Data Fig. 6d). In mouse ES cells, it has been shown that supra-threshold STAT3 activation can shift its role from promoting self-renewal to inducing trophectoderm differentiation via Tfap2c/Cdx2 induction44. We propose that ostrich ES cells intrinsically operate near or above this critical STAT3 activation threshold due to increased expression of LIF receptor components. Elevated levels of LIF receptor/Gp130 may amplify LIF-induced STAT3 signaling beyond the optimal range for pluripotency maintenance, thereby driving differentiation, resembling the phenotype observed in hyper-stimulated mouse ES cells. This dose-dependent STAT3 paradigm, initially characterized in murine systems, may underlie the divergent LIF responses observed across avian species. Together, our findings emphasize the importance of tailoring culture conditions to each species and highlight the utility of supportive compounds, such as SB431542, in fine-tuning the balance between self-renewal and differentiation61,62.
While our study primarily focused on chicken ES cells, further comprehensive investigations are warranted to assess the developmental potential of ES cells from other avian species through chimera formation and germline transmission assays. The lessons learned from developing avian ES cell culture conditions offer valuable insights for deriving pluripotent cell lines from diverse species. Notably, the conservation of key signaling pathways regulating pluripotency across species emphasizes the importance of understanding primary cell signaling responses for successful stem cell line derivation61,62.
Regarding the state of avian pluripotency, we propose that the chicken epiblast at the EGK.X stage and the ES cells derived from it closely parallel the formative state of mouse pluripotency, based on molecular, functional and developmental characteristics. Similar to mouse formative pluripotent cells, the EGK.X epiblast and chicken ES cells exhibit reduced expression of canonical naive pluripotency markers (for example, Tfcp2l1, NR0B1, Fbxo15) compared to earlier pre-oviposition embryos (EGK.III/VI/VIII). Notably, chicken ES cells show high expression of the de novo DNA methyltransferase Dnmt3bwhile lacking expression of primitive streak markers (for example, Tbxt, Foxa2, Gsc), distinguishing them from mouse primed epiblast stem cells (Extended Data Fig. 10a). Whole-genome transcriptional correlation analysis further supports this classification, revealing a greater similarity between chicken ES cells and mouse formative pluripotent cells than to either the naive or primed states (Fig. 3h).
Functionally, a defining characteristic of formative pluripotency is the ability to undergo direct multi-lineage differentiation without previous ‘capacitation’, a requirement for naive cells63,64. Consistent with this, chicken ES cells exhibit robust in vitro differentiation capacity, including rapid responsiveness to differentiation cues (Extended Data Fig. 10b) and specification toward the germline lineage. Furthermore, chimera assays confirm their contribution to both somatic and germline lineages, reinforcing their functional similarity to mouse formative cells.
Developmentally, the formative state in mice spans the postimplantation epiblast (E5.0–E6.5), bridging the naive (pre-implantation, ~E3.5) and primed (~E7.5) phases. The chicken embryo at oviposition (EGK.X) mirrors this developmental window, with the epiblast and hypoblast having undergone morphological segregation and epithelialization underway65. Apicobasal polarity, a hallmark of advancing epiblast maturation, emerges shortly thereafter (EGK.XII–XIII)40.
The signaling requirements further align chicken ES cells with the formative state. In mice, naive pluripotency is maintained by suppressing fibroblast growth factor/extracellular signal-regulated kinase (FGF/ERK) signaling, whereas primed pluripotency requires its activation. Like mouse formative cells, chicken ES cells display minimal reliance on ERK pathway modulation, as both inhibition and hyperactivation compromise survival or induce differentiation. Zebra finch blastoderm cells form Nanog/PouV-high aggregates on ERK inhibition, possibly reflecting their earlier developmental stage at oviposition (EGK.VI/VIII), which may correspond more closely to the mouse naive state39. In addition, canonical Wnt inhibition, critical for stabilizing mouse formative pluripotency, is also essential for chicken ES cell derivation, further supporting a conserved functional requirement64. Despite these converging lines of evidence, the precise classification of avian pluripotency warrants further exploration. Systematic derivation of avian pluripotent stem cells across developmental stages will be critical for elucidating the continuum of pluripotency in birds and refining its correspondence with mammalian states.
In summary, the derivation of germline-competent chicken ES cells addresses a longstanding chicken model system gap, unlocking future research opportunities. Extending this achievement to other avian species will broaden the scope of biological modeling systems and offer new opportunities in the poultry and biotechnology industries.
Methods
Avians and avian fertile eggs
All animal procedures were carried out in accordance with protocols approved by the University of Southern California Institutional Animal Care and Use Committee. Specific-pathogen-free fertile chicken eggs (SPAFAS, White Leghorn) were purchased from Charles River. Fertile avian eggs used for ES cell derivation were purchased from the following sources: chicken breeds includes RIR (AA Laboratory Eggs), White Leghorn, Black Plymouth Rock and Frizzle Polish (all from Meyer Hatchery), pheasant and goose eggs (Sunstate Ranch), ostrich eggs (OstrichLand), Japanese quail and turkey eggs (AA Laboratory Eggs), duck eggs (Metzer Farms) and peafowl eggs (Miyazaki City Phoenix Zoo).
Avian ES cell derivation and maintenance
All avian embryos were staged according to the Eyal-Giladi and Kochav staging system and the Hamburger and Hamilton staging system66,67. Freshly laid avian fertile eggs at EGK.X-XII stages were kept at 16 °C before harvesting embryos. To harvest embryos, a filter paper-based method was applied68. Briefly, a filter paper with a hole at the center was placed on top of the embryo. The outer edge of the filter paper was cut together with the vitelline membrane. The embryo was then released from the yolk together with the filter paper and washed in PBS solution. Next, the embryo was transferred into a 15-ml tube and dissociated by pipetting in N2B27 medium69. Dissociated cells were cultured in tissue culture plates preseeded with mitotically inactivated mouse embryonic fibroblasts. For feeder-free culturing, culture plates were precoated with laminin511-E8 (iMatrix-511, Nippi, Inc.) at 0.35 µg per cm2 for 1 h at 37 °C. The basal medium used for the routine avian ES cell derivation and maintenance was serum-free N2B27 medium supplemented with 10 µg ml−1 ovotransferrin (Sigma, cat. no. C7786), 2.5 µM IWR-1, 2 µM Gö6983, 1 µM SB431542 (all from Selleckchem) and 10 ng ml−1 chicken LIF (Kingfisher). Optionally, 0.5 µM CP-673451 (Selleckchem) can be added to the culture medium to stabilize established chicken ES cells over long-term passaging. For ostrich ES cell culture, chicken LIF was removed from the avian ES cell culture cocktail. All avian ES cells were cultured at 38 °C in 5% C O2. For passaging, avian ES cells were incubated in 0.05% Trypsin-EDTA (Gibco) for 1 min at room temperature and neutralized with serum-containing medium (DMEM + 10% fetal bovine serum). Cells were then collected by centrifuge and resuspended in fresh avian ES cell media. Avian ES cells were cryopreserved using CELLBANKER 2 freezing media (Amsbio).
Generation of GFP-labeled ES cell lines
Avian ES cells carrying a constitutively expressed GFP transgene were generated by lentivirus infection. Lenti-X 293T cells (Takara) were transfected with the pSIN-EF2-GFP-Puro plasmid70 along with pSPAX2 and pVSVG using polyethylenimine (PEI 25,000, Polysciences). Lentivirus particles were subsequently collected and concentrated using the Lenti-X concentrator (Takara) as per the manufacturer’s instructions. Following lentiviral infection, avian ES cells were treated with 0.5 µg ml−1 puromycin (Invitrogen) for 24 h. This selection was repeated for 3–4 times until no obvious cell death occurred on treatment, and a homogenous GFP expression was confirmed under a fluorescence microscope. The sex of each GFP-labeled chicken ES cell line was determined via PCR using Z and W sex chromosome specific primers71,72. Primer sequences are provided in Supplementary Table 5.
RNAscope in situ hybridization
The detection of Nanog mRNA expression in chicken blastodermal cells was carried out using the RNAscope 2.5 HD-BROWN kit (Advance Cell Diagnostics) following the manufacturer’s instructions. A specific RNAscope probe targeting chicken Nanog mRNA (Gg-Nanog) was designed by Advance Cell Diagnostics. Chicken blastodermal cells were isolated from fertile eggs and cultured under various conditions in four-well chamber slides (Nunc Lab-Tek II Chamber Slide, Thermo Fisher Scientific) preseeded with mitotically inactivated mouse embryonic fibroblasts. After a 3-day culture period, cells were fixed in 4% paraformaldehyde and PBS for 30 min, followed by dehydration and rehydration with EtOH. Subsequently, cells were treated with hydrogen peroxide for 10 min at room temperature and washed with distilled water. Cells were then treated with protease plus for 30 min at 40 °C and again washed with distilled water. Next, cells were hybridized with the chicken Nanog probe, GG-PPIB as a positive control or DapB as a negative control for 2 h at 40 °C. A six-step amplification process were then performed to amplify the signal of the hybridization probe. To detect the signal, cells were stained with 3,3′-diaminobenzidine and counter-stained with 50% hematoxylin staining solution. Last, slides were dehydrated, mounted and examined under a microscope.
In situ hybridization
Hybridization chain reaction fluorescence in situ hybridization was performed using labeling kits from Molecular Technologies, following the manufacturer’s protocol73. The probe set for Cvh was designed with a B1 initiator and detected using amplifier hairpins conjugated to Alexa647.
RT–qPCR
Chicken embryos were harvested using the filter paper-based method as described above. Total RNA from chicken embryos and in vitro expanded cells was extracted using the RNeasy Mini Kit (QIAGEN) following the manufacturer’s instructions. Complementary DNA was synthesized from 1 µg of total RNA using the iScript Reverse Transcription Supermix (BIO-RAD) according to the manufacturer’s protocol. RT–qPCR was performed using the iTaq Universal SYBR Green Supermix (BIO-RAD) on an Applied Biosystems QuantStudio 7 Flex Real-Time PCR machine (Applied Biosystems) with melt curve analysis. Cq detection limit is 40 cycles. Gene expression levels were normalized to Gapdh expression. The primers used for RT–qPCR were custom-designed using primer-blast (NCBI) with the criteria of spanning exon–exon junctions, a melting temperature of 60 °C and a PCR product size between 70 bp and 200 bp. Primer sequences are listed in Supplementary Table 5.
Egg yolk fractionation
Here, 20 ml of yolk was collected from 2 unfertilized chicken eggs and further diluted with 80 ml of 0.15 M NaCl (yielding 20% yolk). This 20% yolk was then centrifuged at 30,000g for 2 h at 4 °C. Yolk plasma was collected (designated as 20% plasma) and granules were resuspended in 50 ml of 0.75 M NaCl (as 20% granules). To further fractionate plasma, eight layers of paper towels presoaked with ddH2O were used for initial filtration, and the flow-through was sequentially passed through 0.8-µm, 0.45-µm and 0.2-µm filters (Pall). The final flow-through, referred to as the 0.2-µm filtered fraction, was then applied to Amicon Ultra-15 Centrifugal Filters (Millipore) with a 100-kDa and 50-kDa molecular-weight cutoff at 10,000g for 1 h at 4 °C. This yielded fractions designated as>100 kDa, 50–100 kDa and <50 kDa. All fractions were considered to be at 20% concentration and were added to cell culture medium as a final concentration of 3% for testing.
An ammonium sulfate precipitation was performed to separate proteins in the 50–100 kDa fraction. Saturated ammonium sulfate solution was slowly added into the fraction to achieve a 30% salt concentration, and the mixture was stirred at 4 °C for 1 h followed by centrifugation at 5,000g for 30 min. The pellet was resuspended in 0.15 M NaCl and marked as 30p. The remaining supernatant was loaded again with saturated ammonium sulfate solution to achieve a 40% salt concentration, followed by mixture and concentration. The same procedure was repeated to collect samples marked as 40p, 50p, 60p, 70p and 80p. All these fractions were centrifuged twice with an Amicon Ultra-0.5 Centrifugal Filter Unit at a 3-kDa molecular-weight cutoff to remove any residual ammonium sulfate before cellular assay.
The ammonium sulfate fractions were separated by SDS–PAGE and stained with Coomassie blue. Gel fractions were cut and sent to Proteomics Core Facility at the University of Southern California for liquid chromatography with tandem mass-spectrometry analysis.
Alkaline phosphatase staining
To perform alkaline phosphatase staining, we used Vector Blue Substrate Kit (SK-5300, Vector Laboratories) and followed the manufacturer’s instruction. Briefly, ES cells were fixed using 4% PFA for 1 min at room temperature and washed once with PBS. Working solution was prepared by adding 16 μl of Reagent 1, 16 μl of Reagent 2 and 9 μl of Reagent 3 to 1 ml of 100 mM Tris-HCl buffer (pH 8.2–8.5) with 0.1% Tween-20. Cells were incubated with working solution for 40 min in dark at room temperature. After staining, cells were washed once with PBS and proceeded to imaging analysis.
Growth curve analysis
To analyze the growth kinetics of stem cells cultured in different conditions, 43,000 of chicken ES cells were seeded in 24-well plates in duplicate. Cell counts were performed at every passage using trypan blue dye. Cell counts were plotted against passage numbers using GraphPad Prism software to generate growth curves.
Chromosome analysis
Metaphase spreads were prepared after colcemid and ethidium bromide treatment. G-banding and karyotype analysis was performed at the Molecular Cytogenetics Laboratory, Texas A&M University.
GFP-to-BFP knock-in conversion assay
The GFP+ chicken ES cell line was established from a single transgenic chicken egg ubiquitously expressing GFP (Roslin Green)43. For GFP-to-BFP knock-in conversion, GFP+ chicken ES cells were electroporated using the Neon Transfection System (Thermo Fisher) together with Cas9 ribonucleoprotein and ssODN. Briefly, per each reaction, TrueCut HiFi Cas9 Protein (1,500 ng, Thermo Fisher), TrueGuide Synthetic guide RNA (gRNA) (10 pmol, Thermo Fisher) and ssODN (15 pmol, ultramer DNA oligo from IDT) were incubated in Resuspension buffer R at room temperature for 20 min. Cells were detached, counted and washed with PBS, and then added to the Cas9 ribonucleoprotein and ssODN mixture in Resuspension buffer R to reach to a final volume of 12 μl with 150,000 cells. Cell mixture was electroporated using a 10-μl Neon tip with a program of 1,200 V, 20 ms and 2 pulses (or 1,200 V, 30 ms and 1 pulse). Afterward, cells were directly transferred to the culture plate with prewarmed complete culture medium (OT/3i/chLIF/CP67) plus 10 μM Y-27632 (ROCK inhibitor, Selleckchem). Culture medium was completely changed the next day to remove Y-27632 and cells were maintained on feeder layers. Engineered cells were then sorted according to fluorescence expression pattern and 1,000 sorted cells were seeded in a 12-well plate to allow clonal growth. Individual clones were picked and expanded for genotype analysis. Genomic DNA was extracted using DNeasy Blood & Tissue kit (Qiagen). The sequences of the GFP gRNA, ssODN donor and genotyping PCR primers were obtained from a previous study42 and are listed in Supplementary Table 5.
RNA-seq sample preparation and analysis
Chicken EGK.X-stage embryos were harvested using the filter paper-based method68. Total RNA from chicken ES cells and EGK.X embryos was extracted using the RNeasy Mini Kit (Qiagen). RNA samples were processed for library preparation following the BGISEQ-500 library construction protocol, and library quality was assessed using a Bioanalyzer. Three biological replicates were collected for each cell type, and a minimum of 20 million paired-end reads was generated per replicate. Quail, goose and ostrich ES cell samples were prepared and sequenced using the same protocol.
The sequencing reads were aligned to the Gg6 chicken reference genome (Ensembl GRCg6), quail reference genome (Ensembl Coturnix_japonica.Coturnix_japonica_2.0.113), goose reference genome (Ensembl Anser_cygnoides.GooseV1.0.113) or Ostrich reference genome (Ensembl Struthio_camelus_australis.ASM69896v1.113) using STAR74. RSE75 was used for read count quantification. Differential expression analysis was conducted with DESeq2 (ref. 76), considering genes with a log2 fold change greater than 1, an adjusted P value less than 0.05 and baseMean more than 200 as significant. Principal component analysis and unsupervised hierarchical clustering were performed using counts transformed by DESeq2’s regularized logarithm (Rlog), with plots generated with ggplot2 (ref. 77) and ComplexHeatmap78,79. Gene ontology analysis was carried out using the clusterProfiler package80,81 and the results were visualized using the enrichplot package82. Gene set enrichment analysis was conducted with fgsea package83ranking genes based on log2FC × −log10 (adjusted P value). Signature gene sets for each cell type were determined by selecting genes with a log2 fold change greater than or equal to one and an adjusted P less than 0.1 through pairwise comparison across cell type. The x axis labeled ‘rank’ represents the ranked order of all genes expressed in chicken ES cells, sorted based on their gene expression fold changes (with adjusted P value) compared to the HH4 gene expression profile. Correlation analysis was performed using Pearson correlation, using log2-transformed average fragments per kilobase of transcript per million mapped reads (FPKM) values across replicates of each cell type.
In vitro differentiation of ES cells
Differentiation of avian ES cells into soma tic and germline lineages was induced by the formation of EBs. Avian ES cells were dissociated using TrypLE, resuspended in N2B27 basal medium and plated into tissue culture plates for 1 h to remove feeder cells. Subsequently, loosely attached or floating avian ES cells were collected and plated into Aggrewell-400 24-well plates (StemCell Technologies) at a density of 70,000–150,000 cells per well to allow EB formation in N2B27 basal medium. EBs were harvested from Aggrewell after 4 days, followed by immunostaining and RT–qPCR analysis to assess the expression of lineage markers, including markers for somatic and germ cells. For longer differentiation, EBs were transferred to nonadherent wells for an additional 4-day incubation before being harvested.
For differentiation into neural lineage, EBs were formed overnight using Aggrewell-400 and then transferred to nonadherent wells for additional 3-day culture in N2B27 medium supplemented with 2.5 µM IWR-1, 2 µM Gö6983 and 2 µM SB431542. The medium was then replaced with N2B27 supplemented with 5% chicken serum for another 7 days. Subsequently, EBs were plated onto Matrigel-coated four-well plates and cultured for two more days in the same medium before immunostaining.
For differentiation into cardiomyocytes, EBs were formed overnight using Aggrewell-400 and then transferred to nonadherent wells for additional 3-day culture in N2B27 medium supplemented with 2.5 µM IWR-1 and 2 µM Gö6983. EBs were plated onto gelatin-coated wells and cultured for another 10 days in monolayer before immunostaining.
For differentiation into adipocytes, EBs were formed overnight using Aggrewell-400 in N2B27 medium alone and then transferred to nonadherent wells for additional 2-day culture in N2B27 medium plus 5% fetal bovine serum. Subsequently, EBs were plated onto feeder-seeded wells and cultured for another 10 days before staining.
Oil Red O staining
Cells were fixed with 10% formalin for 30 min and washed 3 times with PBS. Subsequently, cells were incubated with 60% isopropanol for 5 min, followed by staining with Oil Red O working solution (Sigma-Aldrich) for 20 min on a rotator. After staining, the Oil Red O working solution was removed, and cells were washed three times with PBS. Next, cells were treated with hematoxylin for 1 min and rinsed with PBS 5 times before imaging.
Immunostaining
Chimeric embryos or gonadal tissues were fixed in 4% paraformaldehyde at 4 °C overnight and transferred to 30% sucrose until sinking to the bottom of the vial. Subsequently, embryos or tissues were embedded in optimal cutting temperature compound and cryosectioned for immunofluorescence. For staining of attached cells or EBs, cells were fixed in 4% paraformaldehyde for 20 min at room temperature. After fixation, all samples were blocked with PBS containing 5% normal donkey serum and 0.2% Triton X-100 at 4 °C overnight. Samples were then incubated with primary antibodies overnight at 4 °C. After 3 washes in PBS with 0.1% Tween-20, secondary antibodies were applied overnight at 4 °C. Samples were washed 3 times in PBS with 0.1% Triton X-100 before mounting for imaging. Nuclei were stained with Hoechst 33342 (Invitrogen, 1:50,000). Primary antibodies used include: Myosin (MF-20, DSHB, 1:50), TuJ1 (MAB1195, R&D Systems, 1:100), GATA4 (sc-25310, Santa Cruz, 1:100), Brachyury/TBXT (AF2085, R&D systems, 1:300), SOX2 (ab5603, Sigma, 1:500), DAZL (ab215718, Abcam, 1:750), P63 (ab124762, Abcam, 1:500), GFP (A11120, Invitrogen, 1:500), SOX9 (AF3075, R&D Systems, 1:40), SSEA-1 (MC480, DSHB, 1:10), epithelial membrane antigen-1 (DSHB, 1:10). Secondary antibodies used: Goat Anti-Mouse IgM NorthernLights NL557 (NL019, R&D Systems, 1:200), Donkey Anti-Rabbit IgG (H+L)-Cy5-AffiniPure conjugated (711-175-152, Jackson ImmunoResearch, 1:200), Donkey Anti-Goat IgG (H+L)-Cy5-AffiniPure conjugated (705-175-147, Jackson ImmunoResearch, 1:200), Donkey Anti-Rabbit IgG (H+L) DyLight 549 conjugated (611-742-127, Rockland, 1:5,000), Donkey Anti-Mouse IgG (H+L), Alexa Fluor 488 Conjugated (A-21202, Invitrogen, 1:1,000) and Donkey Anti-Mouse IgG (H+L) DyLight 549 conjugated (610-742-124, Rockland, 1:5,000).
Ex ovo chimera formation assay
Albumin agar plates (0.3% w/v agarose, 0.3% w/v glucose with 20 U ml−1 penicillin and 20 µg ml−1 streptomycin) were freshly prepared and used for avian embryo culture. Avian embryos were explanted and cultured with a filter paper carrier on an albumin agar plate according to the EC culture system68. Briefly, a freshly laid egg was poured into a petri dish with the thick albumin being removed to expose the embryo directly to the paper ring. The paper was cut around the perimeter of the embryo, and the embryo was transferred into a dish with PBS to remove any residual yolk. Afterward, the embryo was placed ventral-side up onto the albumin agar plate.
For the chimera formation assay, GFP-labeled avian ES cells were first dissociated using TrypLE for 8 min at room temperature. After neutralization, these cells were again dissociated using 0.025% Trypsin for 3 min at 38 °C to ensure dissociation into single cells. Then, 20,000 GFP-labeled cells were equally distributed on top of the recipient embryo using a glass microcapillary. The embryo was incubated at 38 °C for 2–4 days, and donor cell contribution was monitored by live imaging.
In ovo chimera formation assay
The surrogate eggshell system was employed to culture chimeric chick embryos in ovo84. Optionally, fertile eggs can be irradiated at 500–550 cGy before injection. A surrogate chicken egg, 4 g to 5 g heavier than the recipient fertile egg, was used, and the entire contents of the recipient fertile egg were transferred into this larger surrogate shell. Donor ES cells were dissociated into single cells and prepared as described in the ex ovo chimera formation assay. 7,500 cells were injected into the subgerminal cavity using a glass microcapillary, with a volume of 0.75 µl. After injection, the egg was filled with albumen, covered with cling film and secured using PVC plastic rings wrapped with rubber bands. The reconstituted egg was then placed window-side up on a constantly tilted shaker (about 1 rpm) overnight before being transferred upside down into an incubation cabinet set at 37.5 °C with a rocking angle of 90° at 1-h intervals. After 3–4 days of incubation, the chimerism of the injected embryo was determined by live imaging based on GFP signal. To further incubate the chimeric embryo, a jumbo chicken egg weighing 20–25 g heavier than the recipient egg was used as a secondary surrogate shell. The entire content of the chimeric embryo was carefully transferred into this jumbo surrogate shell and sealed with cling film. The chimeric embryo in this jumbo shell was then incubated in an incubator at 37.5 °C until hatching.
The window method was used for quail ES cell transplantation into quail embryos and in ovo culture thereafter85. Irradiation at 500 cGy was applied to the recipient eggs if necessary. Wild-type Japanese quail eggs were sanitized with 70% ethanol and placed with the narrow end up for 2 h at room temperature. Subsequently, eggs were placed laterally for 2 h before injection to allow the embryo to float to the lateral apex of the eggs. A 4 mm by 4 mm window was drilled at the lateral apex of the eggshell using a handheld rotary tool (Dremel), and the shell membrane was removed using forceps. Donor ES cells were injected into the subgerminal cavity following the same procedure described in the surrogate method above. After injection, the window was sealed with plastic tape, and eggs were placed with the blunt end up in an incubator cabinet set at 37.5 °C with a rocking angle of 90° at 1-h intervals.
Feather histology and immunohistochemistry
Feather follicle samples were collected from adult roosters and fixed in 4% paraformaldehyde in PBS overnight. Subsequently, the samples were serially dehydrated with alcohol and embedded in paraffin. Paraffin sections were stained with hematoxylin and eosin or analyzed by immunohistochemistry staining49. The following antibodies were used: MITF (ab12039, Abcam, 1:800) and GFP (A11120, Invitrogen, 1:500). For immunohistochemistry staining, color development was achieved using the AEC peroxidase substrate kit (Vector Laboratories).
Statistics
Statistical significance between groups was assessed using Student’s t-test (two-sided) or one-way analysis of variance, as appropriate. For mass-spectrometry data, statistical significance was determined using one-way analysis of variance followed by Dunnett’s multiple-comparison test. Data are presented as mean ± s.d. from a minimum of three independent experiments unless otherwise noted in the figure legends.
Reporting summary
Further information on research design is available in the Nature Portfolio Reporting Summary linked to this article.
Data availability
The RNA-seq datasets generated in this study have been uploaded to the Gene Expression Omnibus under the accession numbers GSE254284 (chicken) and GSE298550 (quail, goose and ostrich). Publicly available RNA-seq datasets used in this study: mouse ES cells in naive, formative and primed states. GSE131555 (ref. 64); chicken embryos from EGK.I to EGK.VIII. GSE86592 (ref. 86); chicken embryos at HH4. SRX540095 (Weizmann Institute). Publicly available reference genomes used in this study: chicken reference genome (Ensembl GRCg6_106), quail reference genome (Ensembl Coturnix_japonica.Coturnix_japonica_2.0.113), goose reference genome (Ensembl Anser_cygnoides.GooseV1.0.113) and Ostrich reference genome (Ensembl Struthio_camelus_australis.ASM69896v1.113).
References
-
Stern, C. D. The chick: a great model system becomes even greater. Dev. Cell 89–17 (2005).
CAS PubMed Google Scholar
-
Beacon, T. H. & Davie, J. R. The chicken model organism for epigenomic research. Genome 64476–489 (2021).
Article CAS PubMed Google Scholar
-
Romanov, M. N. et al. The value of avian genomics to the conservation of wildlife. BMC Genomics 10S10 (2009).
Article PubMed PubMed Central Google Scholar
-
Dodgson, J. B. & Romanov, M. N. Use of chicken models for the analysis of human disease. Curr. Protoc. Hum. Genet. 4015.5.1–15.5.12 (2004).
Google Scholar
-
Martin, G. R. Isolation of a pluripotent cell line from early mouse embryos cultured in medium conditioned by teratocarcinoma stem cells. Proc. Natl Acad. Sci. USA 787634–7638 (1981).
Article CAS PubMed PubMed Central Google Scholar
-
Evans, M. J. & Kaufman, M. H. Establishment in culture of pluripotential cells from mouse embryos. Nature 292154–156 (1981).
Article CAS PubMed Google Scholar
-
Buehr, M. et al. Capture of authentic embryonic stem cells from rat blastocysts. Cell 1351287–1298 (2008).
Article CAS PubMed Google Scholar
-
Li, P. et al. Germline competent embryonic stem cells derived from rat blastocysts. Cell 1351299–1310 (2008).
Article CAS PubMed PubMed Central Google Scholar
-
Petitte, J. N., Clark, M. E., Liu, G., Verrinder Gibbins, A. M. & Etches, R. J. Production of somatic and germline chimeras in the chicken by transfer of early blastodermal cells. Development 108185–189 (1990).
Article CAS PubMed Google Scholar
-
Pain, B. et al. Long-term in vitro culture and characterisation of avian embryonic stem cells with multiple morphogenetic potentialities. Development 1222339–2348 (1996).
Article CAS PubMed Google Scholar
-
Petitte, J. N., Liu, G. & Yang, Z. Avian pluripotent stem cells. Mech. DEV. 1211159–1168 (2004).
Article CAS PubMed Google Scholar
-
Van De Lavoir, M. C. et al. High-grade transgenic somatic chimeras from chicken embryonic stem cells. Mech. DEV. 12331–41 (2006).
Article PubMed Google Scholar
-
Nakano, M. et al. Characteristics of novel chicken embryonic stem cells established using chicken leukemia inhibitory factor. J. Poult. Sci. 4864–72 (2011).
Article CAS Google Scholar
-
Bertocchini, F. & Chuva de Sousa Lopes, S. M. Germline development in amniotes: a paradigm shift in primordial germ cell specification. Bioessays 38791 (2016).
Article PubMed PubMed Central Google Scholar
-
van de Lavoir, M.-C. et al. Germline transmission of genetically modified primordial germ cells. Nature 441766–769 (2006).
Article PubMed Google Scholar
-
Whyte, J. et al. FGF, insulin, and SMAD signaling cooperate for avian primordial germ cell self-renewal. Stem Cell Rep. 51171–1182 (2015).
Article CAS Google Scholar
-
Doddamani, D. et al. Propagation of goose primordial germ cells in vitro relies on FGF and BMP signalling pathways. Commun. Biol. 8301 (2025).
Article CAS PubMed PubMed Central Google Scholar
-
Smith, A. Formative pluripotency: the executive phase in a developmental continuum. Development 144365–373 (2017).
Article CAS PubMed PubMed Central Google Scholar
-
Carroll, S. B. Evo-devo and an expanding evolutionary synthesis: a genetic theory of morphological evolution. Cell 13425–36 (2008).
Article CAS PubMed Google Scholar
-
Wagner, G. P. & Lynch, V. J. The gene regulatory logic of transcription factor evolution. Trends Ecol. Evol. 23377–385 (2008).
Article PubMed Google Scholar
-
Parker, H. J., Bronner, M. E. & Krumlauf, R. A Hox regulatory network of hindbrain segmentation is conserved to the base of vertebrates. Nature 514490–493 (2014).
Article CAS PubMed PubMed Central Google Scholar
-
Zhang, G. et al. Comparative genomics reveals insights into avian genome evolution and adaptation. Science 3461311–1320 (2014).
Article CAS PubMed PubMed Central Google Scholar
-
Zhang, G. et al. Comparative genomic data of the avian phylogenomics project. Gigascience 326 (2014).
Article PubMed PubMed Central Google Scholar
-
Chambers, I. et al. Functional expression cloning of nanog, a pluripotency sustaining factor in embryonic stem cells. Cell 113643–655 (2003).
Article CAS PubMed Google Scholar
-
Mitsui, K. et al. The homeoprotein nanog is required for maintenance of pluripotency in mouse epiblast and ES cells. Cell 113631–642 (2003).
Article CAS PubMed Google Scholar
-
Shimo-oka, T., Hagiwara, Y. & Ozawa, E. Class specificity of transferin as a muscle traphic factor. J. Cell. Physiol. 126341–351 (1986).
Article CAS PubMed Google Scholar
-
Sorokin, L. M. & Morgan, E. H. Species specificity of transferrin binding, endocytosis and iron internalization by cultured chick myogenic cells. J. Comp. Physiol. B. 158559–566 (1988).
Article CAS PubMed Google Scholar
-
Noseda, M., Peterkin, T., Simões, F. C., Patient, R. & Schneider, M. D. Cardiopoietic factors: extracellular signals for cardiac lineage commitment. Circ. Res. 108129–152 (2011).
Article CAS PubMed Google Scholar
-
Horiuchi, H. et al. Chicken leukemia inhibitory factor maintains chicken embryonic stem cells in the undifferentiated state. J. Biol. Chem. 27924514–24520 (2004).
Article CAS PubMed Google Scholar
-
Levenstein, M. E. et al. Basic fibroblast growth factor support of human embryonic stem cell self-renewal. Stem Cells 24568–574 (2006).
Article CAS PubMed Google Scholar
-
Przybyla, L. & Voldman, J. Probing embryonic stem cell autocrine and paracrine signaling using microfluidics. Annu. Rev. Anal. Chem. 5293–315 (2012).
Article CAS Google Scholar
-
Lavial, F. et al. The Oct4 homologue PouV and Nanog regulate pluripotency in chicken embryonic stem cells. Development 1343549–3563 (2007).
Article CAS PubMed Google Scholar
-
Katayama, M. et al. Induced pluripotent stem cells of endangered avian species. Commun. Biol. 51049 (2022).
Article CAS PubMed PubMed Central Google Scholar
-
Desbaillets, I., Ziegler, U., Groscurth, P. & Gassmann, M. Embryoid bodies: an in vitro model of mouse embryogenesis. Exp. Physiol. 85645–651 (2000).
Article CAS PubMed Google Scholar
-
Nichols, J. et al. Formation of pluripotent stem cells in the mammalian embryo depends on the POU transcription factor Oct4. Cell 95379–391 (1998).
Article CAS PubMed Google Scholar
-
Sakaki-Yumoto, M. et al. The murine homolog of SALL4, a causative gene in Okihiro syndrome, is essential for embryonic stem cell proliferation, and cooperates with Sall1 in anorectal, heart, brain and kidney development. Development 1333005–3013 (2006).
Article CAS PubMed Google Scholar
-
Wu, Q. et al. Sall4 interacts with Nanog and co-occupies Nanog genomic sites in embryonic stem cells. J. Biol. Chem. 28124090–24094 (2006).
Article CAS PubMed Google Scholar
-
Zhang, J. et al. Sall4 modulates embryonic stem cell pluripotency and early embryonic development by the transcriptional regulation of Pou5f1. Nat. Cell Biol. 81114–1123 (2006).
Article CAS PubMed Google Scholar
-
Mak, S.-S. et al. Characterization of the finch embryo supports evolutionary conservation of the naive stage of development in amniotes. eLife 4E07178 (2015).
Article PubMed PubMed Central Google Scholar
-
Lee, H. C. et al. Molecular anatomy of the pre-primitive-streak chick embryo. Open Biol 10190299 (2020).
Article CAS PubMed PubMed Central Google Scholar
-
Glaser, A., Mc Coll, B. & Vadolas, J. GFP to BFP conversion: a versatile assay for the quantification of CRISPR/Cas9-mediated genome editing. Mol. Ther. Nucleic Acids 5E334 (2016).
Article CAS PubMed PubMed Central Google Scholar
-
Idoko-Akoh, A., Taylor, L., Sang, H. M. & McGrew, M. J. High fidelity CRISPR/Cas9 increases precise monoallelic and biallelic editing events in primordial germ cells. Sci. Rep. 815126 (2018).
Article PubMed PubMed Central Google Scholar
-
McGrew, M. J. et al. Localised axial progenitor cell populations in the avian tail bud are not committed to a posterior Hox identity. Development 1352289–2299 (2008).
Article CAS PubMed Google Scholar
-
Tai, C.-I., Schulze, E. N. & Ying, Q.-L. Stat3 signaling regulates embryonic stem cell fate in a dose-dependent manner. Biol. Open 3958–965 (2014).
Article PubMed PubMed Central Google Scholar
-
huang, y., Osorno, R., Tsakiridis, A. & Wilson, V. In Vivo Differentiation Potential of Epiblast stem cells revealed by chimeric embryo formation. Cell Rep. 21571–1578 (2012).
Article CAS PubMed Google Scholar
-
Cohen, M. A., Markoulaki, S. & Jaenisch, R. Matched developmental timing of donor cells with the host is crucial for chimera formation. Stem Cell Rep. 101445–1452 (2018).
Article CAS Google Scholar
-
Perry, M. M. A complete culture system for the chick embryo. Nature 33170–72 (1988).
Article CAS PubMed Google Scholar
-
Carsience, R. S., Clark, M. E., Verrinder Gibbins, A. M. & Etches, R. J. Germline chimeric chickens from dispersed donor blastodermal cells and compromised recipient embryos. Development 117669–675 (1993).
Article CAS PubMed Google Scholar
-
Lin, S. J. et al. Topology of feather melanocyte progenitor niche allows complex pigment patterns to emerge. Science 3401442–1445 (2013).
Article CAS PubMed PubMed Central Google Scholar
-
Kerje, S. et al. The Dominant white, Dun and Smoky color variants in chicken are associated with insertion/deletion polymorphisms in the PMEL17 gene. Genetics 1681507–1518 (2004).
Article CAS PubMed PubMed Central Google Scholar
-
Steingrímsson, E. et al. Molecular basis of mouse microphthalmia (mi) mutations helps explain their developmental and phenotypic consequences. Nat. Genet. 8256–263 (1994).
Article PubMed Google Scholar
-
Nele, M., Nriwis, K., T., T. Br. Poult. Sci. 3279–86 (1991).
Article CAS PubMed Google Scholar
-
Lavial, F. et al. Ectopic expression of Cvh (Chicken Vasa homologue) mediates the reprogramming of chicken embryonic stem cells to a germ cell fate. Dev. Biol. 33073–82 (2009).
Article CAS PubMed Google Scholar
-
Nakamura, Y. et al. X-irradiation removes endogenous primordial germ cells (PGCs) and increases germline transmission of donor PGCs in chimeric chickens. J. Reprod. Dev. 58432–437 (2012).
Article PubMed Google Scholar
-
Mozdziak, P. E., Angerman-Stewart, J., Rushton, B., Pardue, S. L. & Petitte, J. N. Isolation of chicken primordial germ cells using fluorescence-activated cell sorting. Poult. Sci. 84594–600 (2005).
Article CAS PubMed Google Scholar
-
Guioli, S., Zhao, D., Nandi, S., Clinton, M. & Lovell-Badge, R. Oestrogen in the chick embryo can induce chromosomally male ZZ left gonad epithelial cells to form an ovarian cortex that can support oogenesis. Development 147dev181693 (2020).
Article CAS PubMed PubMed Central Google Scholar
-
Khwatenge, C. N. & Nahashon, S. N. Recent advances in the application of CRISPR/Cas9 gene editing system in poultry species. Front. Genet. 12627714 (2021).
Article CAS PubMed PubMed Central Google Scholar
-
Stanton, M. M. et al. Prospects for the use of induced pluripotent stem cells in animal conservation and environmental protection. Stem Cells Transl. Med. 87 (2019).
Article PubMed Google Scholar
-
Nakamura, Y., Kagami, H. & Tagami, T. Development, differentiation and manipulation of chicken germ cells. Dev. Growth Differ. 5520–40 (2013).
Article PubMed Google Scholar
-
Bednarczyk, M., Lakota, P. & Siwek, M. Improvement of hatchability of chicken eggs injected by blastoderm cells. Poult. Sci. 791823–1828 (2000).
Article CAS PubMed Google Scholar
-
Chen, X., Ye, S. & Ying, Q.-L. Stem cell maintenance by manipulating signaling pathways: past, current and future. BMB Rep. 48668–676 (2015).
Article CAS PubMed PubMed Central Google Scholar
-
Ying, Q.-L. & Smith, A. The art of capturing pluripotency: creating the right culture. Stem Cell Rep. 81457–1464 (2017).
Article Google Scholar
-
Rostovskaya, M., Stirparo, G. G. & Smith, A. Capacitation of human naïve pluripotent stem cells for multi-lineage differentiation. Development 146dev172916 (2019).
Article CAS PubMed PubMed Central Google Scholar
-
Kinoshita, M. et al. Capture of mouse and human stem cells with features of formative pluripotency. Cell Stem Cell 28453–471 (2021).
Article CAS PubMed PubMed Central Google Scholar
-
Hamidi, S. et al. Mesenchymal-epithelial transition regulates initiation of pluripotency exit before gastrulation. Development 147dev184960 (2020).
Article CAS PubMed Google Scholar
-
Eyal-Giladi, H. & Kochav, S. From cleavage to primitive streak formation: a complementary normal table and a new look at the first stages of the development of the chick. I. General morphology. Dev. Biol. 49321–337 (1976).
Article CAS PubMed Google Scholar
-
Hamburger, V. & Hamilton, H. L. A series of normal stages in the development of the chick embryo. J. Morphol. 8849–92 (1951).
Article CAS PubMed Google Scholar
-
Chapman, S. C., Collignon, J., Schoenwolf, G. C. & Lumsden, A. Improved method for chick whole-embryo culture using a filter paper carrier. Dev. Man. 220284–289 (2001).
3.0.CO;2-5″ data-track-item_id=”10.1002/1097-0177(20010301)220:3<284::AID-DVDY1102>3.0.CO;2-5″ data-track-value=”article reference” data-track-action=”article reference” href=”https://doi.org/10.1002%2F1097-0177%2820010301%29220%3A3%3C284%3A%3AAID-DVDY1102%3E3.0.CO%3B2-5″ aria-label=”Article reference 68″ data-doi=”10.1002/1097-0177(20010301)220:3<284::AID-DVDY1102>3.0.CO;2-5″>Article CAS PubMed Google Scholar
-
Ying, Q.-L. et al. The ground state of embryonic stem cell self-renewal. Nature 453519–523 (2008).
Article CAS PubMed PubMed Central Google Scholar
-
Tai, C.-I. & Ying, Q.-L. Gbx2, a LIF/Stat3 target, promotes reprogramming to and retention of the pluripotent ground state. J. Cell Sci. 1261093–1098 (2013).
Article CAS PubMed Google Scholar
-
Smith, C. A. & Sinclair, A. H. Sex determination: insights from the chicken. Bioessays 26120–132 (2004).
Article CAS PubMed Google Scholar
-
Hou, B. et al. Development of a sensitive and specific multiplex PCR method for the simultaneous detection of chicken, duck and goose DNA in meat products. Meat Sci. 10190–9 4 (2015).
Article CAS PubMed Google Scholar
-
Choi, H. M. T. et al. Third-generation in situ hybridization chain reaction: multiplexed, quantitative, sensitive, versatile, robust. Development 145dev165753 (2018).
Article PubMed PubMed Central Google Scholar
-
Dobin, A. et al. STAR: ultrafast universal RNA-seq aligner. Bioinformatics 2915–21 (2013).
Article CAS PubMed Google Scholar
-
Li, B. & Dewey, C. N. RSEM: accurate transcript quantification from RNA-Seq data with or without a reference genome. BMC Bioinf. 12323 (2011).
Article CAS Google Scholar
-
Love, M. I., Huber, W. & Anders, S. Moderated estimation of fold change and dispersion for RNA-seq data with DESeq2. Genome Biol. 15550 (2014).
Article PubMed PubMed Central Google Scholar
-
Wickham, H. Ggplot2: Elegant Graphics for Data Analysis (Springer-Gerlag, 2016).
Book Google Scholar
-
Gu, Z., Eils, R. & Schlesner, M. Complex heatmaps reveal patterns and correlations in multidimensional genomic data. Bioinformatics 322847–2849 (2016).
Article CAS PubMed Google Scholar
-
Gu, Z. Complex heatmap visualization. achieve 1e43 (2022).
-
Wu, T. et al. clusterProfiler 4.0: a universal enrichment tool for interpreting omics data. Innovation 2100141 (2021).
CAS PubMed PubMed Central Google Scholar
-
Yu, G., Wang, L.-G., Han, Y. & He, Q.-Y. clusterProfiler: an R package for comparing biological themes among gene clusters. OMICS 16284–287 (2012).
Article CAS PubMed PubMed Central Google Scholar
-
Yu, G. enrichplot: visualization of functional enrichment result (Bioconductor, 2023).
-
Korotkevich, G. et al. Fast gene set enrichment analysis. Preprint at BIORHIVIVE https://doi.org/10.1101/060012 (2021).
-
Borwompinyo, S., Brake, J., Mozdziak, P. E. & Petitte, J. N. Culture of chicken embryos in surrogate eggshells. Poult. Sci. 841477–1482 (2005).
Article CAS PubMed Google Scholar
-
Scott, B. B. & Lois, C. Generation of tissue-specific transgenic birds with lentiviral vectors. Proc. Natl Acad. Sci. USA 10216443–16447 (2005).
Article CAS PubMed PubMed Central Google Scholar
-
Hwang, Y. S., Seo, M., Bang, S., Kim, H. & Han, J. Y. Transcriptional and translational dynamics during maternal‐to‐zygotic transition in early chicken development. FASEB J. 322004–2011 (2018).
Article CAS PubMed Google Scholar
Download references
Acknowledgements
We thank the Proteomics Core Facility at the University of Southern California for liquid chromatography with tandem mass-spectrometry analysis; the Millard and Muriel Jacobs Genetics and Genomics Laboratory at the California Institute of Technology for next-generation sequencing; the Molecular Cytogenetics Laboratory at Texas A&M University for karyotype analysis; Miyazaki City Phoenix Zoo (Miyazaki, Japan), Kumamoto City Zoological and Botanical Gardens (Kumamoto), Kurume Bird Center (Fukuoka), Hirakawa Zoological Park (Kagoshima), Osaki Peacock Park (Nagasaki) and Nansei Environmental Laboratory Co., Ltd (Okinawa) for their generous supply of fertilized blue peafowl eggs; D. McKim for valuable comments, discussions and proofreading of the paper; and M. Nakakubo, N. Matsubara and T. Seto for their technical assistance. Funding: this work was supported by the Chen Yong Foundation of the Zhongmei Group, the Wu & Jiang Research Fund and the Xia Research Fund: grant nos. NIH/NIGMS R01 GM151373 and NIH/NIGMS R41 GM146516 to Q.-L.Y. and the Revive & Restore Biotechnology for Bird Conservation grants to Q.-L.Y., G.S. and C.L. C.-M.C. and P.W. were supported by grant nos. NIH/NIAMS R01 AR047364 and AR060306 and the research contract no. 005884 between the University of Southern California (USC) and the China Medical University in Taiwan. G.S. was supported by Japan Society for the Promotion of Science grant nos. 18H02452 and 21H02490, the Japan Science and Technology Agency e-ASIA Joint Research Project no. JPMJSC19E5 and the Takeda Science Foundation Research Grant. X.C. was supported by the predoctoral fellowship from the NICHD/USC Joint T32 Training Program in Developmental Biology, Stem Cells and Regeneration, and a Della Martin postdoctoral Fellowship in Mental Illness at Caltech. Z.G. was supported by the California Institute for Regenerative Medicine Predoctoral Training Fellowship in Stem Cell Biology and Tissue Regeneration.
Ethics declarations
Competing interests
Q.-L.Y., X.C., Z.G., X.T. and X.L. are inventors on a patent (WO2023158627A3) entitled ‘Methods for derivation and propagation of avian pluripotent stem cells and applications thereof’ arising from this work. The other authors declare no competing interests.
Peer review
Peer review information
Nature Biotechnology thanks Björn Oback and the other, anonymous, reviewer(s) for their contribution to the peer review of this work.
Additional information
Publisher’s note Springer Nature remains neutral with regard to jurisdictional claims in published maps and institutional affiliations.
Extended data
Extended Data Fig. 1 Development of culture conditions for chicken ESC derivation.
aRepresentative images of chicken blastodermal cells cultured in the indicated conditions for 3 days. Scale bars, 50 μm. bA representative image of ch icken blastodermal cells cultured in IWR-1 + Gö6983 for 3 days. The right panel provides a zoom-in view of the dotted area within the image on the left panel. Scale bars, 100 μm (left panel), 50 μm (right panel). cDetection of Nanog mRNA expression by RNAscope on-site hybridization in chicken blastodermal cells cultured in the indicated conditions for 3 days. Scale bars, 100 μm. d, eRepresentative images of chicken blastodermal cells cultured in the indicated conditions for 10 days, with passaging once (d), or without passaging (e). Scale bars, 50 μm. fA representative image of chicken blastodermal cells cultured in IWR + Gö6983 supplemented with 3% yolk (Yolk/2i) collected from a fertile egg (passage 1, total 10 days). Scale bar, 50 μm. gRT-qPCR analysis of Nanog mRNA expression in chicken ESCs cultured with or without Yolk/2i for 5 days. EGK.X and E5 embryos were included as positive and negative controls, respectively. Data represent mean ± s.d. from three biological replicates. Cell images in a–f are from one representative experiment of at least 3 experiments performed.
Extended Data Fig. 2 Ovotransferrin is the main self-renewal-promoting component from yolk for chicken ESC maintenance.
aRepresentative images of chicken ESCs cultured with or without the indicated yolk fractions (passage 1, total of 10 days). NT, non-treatment control. bRepresentative images of chicken ESCs cultures supplemented with the indicated ammonium sulfate precipitates from the 50–100 kDa fraction. cList of the top 10 peptides (ranked by Sequest HT score) identified by mass-spec analysis from the 80p fraction (precipitates at 80% saturation of ammonium sulfate from the 50–100 kDa fraction), compared with peptide coverage in the 50p and 70p fractions. *Peptides identified with a distinct accession number in the mass-spec analysis. Coverage refers to the percentage of a protein’s amino acid sequence that is identified by the detected peptides in the analysis. The three boxes under ‘Trend’ correlates to the percentage of the listed proteins being found in the three fractions. See details in Supplementary Table 2. dRepresentative images of chicken ESCs maintained in IWR-1 + Gö6983+ ovotransferrin (OT/2i). BPR, Barred Plymouth Rock, cells at p14. WL, White Leghorn, cells at p15. FPC, Frizzle Polish chicken, cells at p10. eRepresentative images of chicken ESCs cultured with or without the indicated supplements for 6 days. NT, non-treatment control. fGrowth curve analysis of chicken ESCs culture in IWR-1 + Gö6983 with or without ovotransferrin, human transferrin, or the 80p fraction. Data represent mean of two biological replicates. gAP staining of mouse and chicken ESCs. Scale bars, 50 μm. hAP staining of chicken ESCs cultured under the indicated conditions. Cell images in a, b, d, e, g are from one representative experiment of at least 3 experiments performed.
Extended Data Fig. 3 Derivation of ESCs from multiple avian species.
aImmunofluorescence staining of pheasant blastodermal cells cultured in OT/2i for 2 passages. b-dblastodermal cells from different avian species cultured in OT/2i with or without SB431542 (SB43). eQuail blastodermal cells cultured in OT/2i with or without the indicated supplements. huLIF, human LIF. chLIF, chicken LIF. fAP staining of quail ESCs cultured in OT/3i with or without chLIF for 4 passages. gRepresentative images of ostrich ESCs maintained in the indicated conditions. hAP staining of ostrich ESCs in OT/3i with or without chLIF for 5 passages. i,jG-banded karyotypes for chicken (i) and quail (j) ESC lines. kRepresentative images of unstable chicken ESCs cultured in the OT/3i/chLIF condition with or without CP-673451 (CP-67). lClonogenicity of chicken ESCs cultured in the OT/3i/chLIF condition with or without CP-67. Data represent the mean of two biological replicates. mPhase-contrast images of HH2-HH5 chicken embryonic cells cultured in OT/3i/chLIF. All cell images are from one representative experiment of at least 3 experiments performed. Scale bars, 50 μm.
Extended Data Fig. 4 Gene expression analysis of chicken ESCs and cells isolated from different developmental stages of chicken embryos.
aImmunostaining of chicken ESCs cultured in OT/3i/chLIF. n = 3 independent experiments. bRT-qPCR analysis illustrating the relative expression levels of lineage marker genes in embryoid bodies derived from chicken ESCs. Data represent the mean ± s.d. of three biological replicates. cOil-red staining of chicken ESC-derived adipocytes. n = 3 independent experiments. dHeatmap analysis comparing the differential gene expression profiles of chicken embryonic stem cells (ESCs) and chicken primary cells isolated from EGK.I to HH4 stage embryos. EGK.I to VIII data sourced from accession number GSE86592; HH4 data obtained from GenBank: SRX893876. eScatter plots showing FPKM values with Pearson correlations between chicken ESCs/EGK.X, chicken ESCs/HH4, and EGK.X/HH4. Statistical significance was shown by a two-sided p-value. fGene set enrichment analysis showing enrichment score of EGK.X and HH4 signature in chicken ESCs respectively. NES, normalized enrichment score. Enrichment score was calculated using KS-like running sum statistic. gHeatmap analysis showing the differential gene expression profiles between chicken ESCs, EGK.X and HH4. hGene Ontology analysis of Group B upregulated genes (g) in chicken ESCs. Group B upregulated genes represent genes expressed at higher levels in chicken ESCs and were not differentially expressed in EGK.X and HH4 stages. The significance was determined using Hypergeometric test. Scale bars, 50 μm.
Extended Data Fig. 5 GFP-to-BFP knock-in conversion in chicken ESCs.
aSchematic illustrating the design of the GFP-to-BFP conversion. The purple line underscores the GFP gRNA used in this assay. Nucleotide changes introduced by the ssODN donor are highlighted in red. The exact sequences of the GFP gRNA and ssODN are provided in Supplementary Table 5. bRepresentative FACS plots showing the percentages of GFP/BFP-positive cells in control and engineered samples. Note that both samples contain feeder cells, which were GFP/BFP-negative. cRepresentative images of GFP control cells and engineered cells after cell sorting and clonal expansion. n = 3 independent experiments. Scale bars, 50 μm. dSanger sequencing traces of genomic DNA amplicons from GFP control and engineered clonal lines. Nucleotide changes are marked in red. The yellow box highlights an extra C nucleotide insertion in one allele of BFP+/GFP− clone 2. The purple line and orange lines mark the GFP gRNA sequence and PAM site, respectively. The dashed line indicates the Cas9 cutting site.
Extended Data Fig. 6 Avian ESCs express core pluripotency-related factors.
aAP staining of goose ESCs. bImmunostaining of cells differentiated from quail ESCs. cExpression profiling of pluripotency-related genes across ESCs from different avian species. dExpression profiling of LIF receptor and Gp130 across ESCs from the four avian species. Data represent mean ± SEM of three biological replicates for chicken ESCs and mean of two biological replicates for quail, goose and ostrich ESCs. Scale bars, 50 μm.
Extended Data Fig. 7 Chicken ESCs can contribute to chimera formation.
aSurrogate open-shell system used for the injection of chicken ESCs into chicken embryos. bSequential images showing the development and hatchling of a chicken embryo injected with chicken ESCs using the surrogate open-shell system. cRepresentative images showing biased lineage contribution in low-rate chicken ESC/embryo chimeras. left panel, E6 chimera (scale bar, 200 μm); right panel, E7 chimera (scale bar, 400 µm). dThe ratios of chimerism in chicken ESC/chicken embryo chimeras generated via non-irradiation and irradiation methods. eImages showing chimeric chicken embryos across different developmental stages. Chimeric chickens were generated by injecting GFP-positive chicken ESCs (60 passages on feeder plus 15 passages on feeder-free) into EGK.X stage chicken embryos. Scale bars, 500 μm. fImmunostaining images showing GFP-positive donor chicken ESCs contributing to ectoderm and mesoderm lineages within the chimeric embryo. Top panel, transverse cryosection of the neural tube in a HH10 chimera. Bottom panel, whole-mount staining of the posterior end in a HH5 chimera. Arrows indicate double-positive donor-derived cells. Scale bars, 20 μm. Zoom-in scale bar, 5 μm. Chimeras generated in c, e, fare from one representative experiment of at least 3 experiments performed.
Extended Data Fig. 8 Contribution of chicken ESCs to feather patterning.
aA chimeric rooster generated by injecting Rhode Island Red ESCs into a White Leghorn EGK.X stage embryo. The image displays both donor-derived (black/brown) and recipient (white) feather pattern. b-dImages showing the morphologies of contour feathers from adult White Leghorn (b), Rhode Island Red (c), and the chimeric chicken (d). egH&E staining of feather follicles from adult White Leghorn (e), Rhode Island Red (f), and the chimeric chicken (g). h-jBright view of feather follicles from adult White Leghorn (h), Rhode Island Red (i), and the chimeric chicken (j). k-mMITF staining for melanocyte progenitor cells from adult White Leghorn (k), Rhode Island Red (l), and the chimeric chicken (m). nGFP fluorescence images showing GFP-positive chicken ESC-derived cells within adult chimeric feather follicles. Images generated in e–n are from one representative experiment of at least 3 experiments performed. Scale bars, 100 μm.
Extended Data Fig. 9 Avian ESCs give rise to PGC like cells in vitro.
aImmunostaining of DAZL in chic ken ESCs maintained in OT/3i/chLIF. Scale bars, 50 μm. bImmunostaining of DAZL in goose ESCs cultured in OT/3i/chLIF before and after clonal expansion. Scale bars, 50 µm. c, d, On-site HCR staining using a cvh probe in a chicken HH8 embryo (c) and in chicken ESC-derived EBs (d). Scale bar, 10 µm. eImmunostaining of an E22 testis section from a chimera generated by injecting GFP-labeled chicken ESCs into the subgerminal cavity of an EGK.X chicken embryo. Arrows indicate GFP- and DAZL-double positive cells; arrowheads indicate cells positive for either GFP or DAZL alone. Scale bar, 100 µm. All images generated are from one representative experiment of at least 3 experiments performed.
Extended Data Fig. 10 Chicken ESCs resemble the formative state of mouse pluripotency.
aGene expression profiles in EGK.III to HH4 stage chick embryos and chicken ESCs. Data represent mean ± SEM of three biological replicates for all samples, except HH4 embryos, which have two biological replicates and mean values are displayed. bImmunostaining of chicken ESCs for the mesoderm marker TBXT marker, with or without mesoderm induction. For induction, cells were treated with 3 μM CHIR99021 and 10 ng ml−1 bFGF for 24 hours. Scale bars, 50 μm.
Supplementary information
Reporting Summary
Supplementary Table 1
The list of compounds and growth factors tested for chicken ES cell derivation.
Supplementary Table 2
Lists of proteins and peptides identified by mass-spectrometry analysis of the 50p, 70p and 80p fractions from the 50–100-kDa yolk plasma.
Supplementary Table 3
Summary of representative chimeric embryos generated from avian ES cells.
Supplementary Table 4
Summary of chimeric embryos examined for germline contribution from GFP+ chicken ES cells.
Supplementary Table 5
Primer sequences used in this study.
Supplementary Video 1
Beating colonies emerged from duck, pheasant, and turkey blastodermal cells cultured in OT/2i.
Supplementary Video 2
Contribution of GFP-labeled chicken ES cells to the beating heart of a nonirradiated E4 chicken embryo. Constitutively GFP-expressing chicken ES cells were injected into the subgerminal cavity of a nonirradiated EGK.X-stage chicken embryo and incubated using the surrogate shell system. On day 4, live imaging of green fluorescence was performed.
Supplementary Video 3
Contribution of GFP-labeled chicken ES cells to both somatic and extra-embryonic lineage in a sublethally irradiated E4 chicken embryo. Constitutively GFP-expressing chicken ES cells were injected into the subgerminal cavity of an EGK.X-stage chicken embryo treated with 500 cGy. The embryo was incubated using the surrogate shell system. On day 4, live imaging of green fluorescence spanning both embryonic and extra-embryonic regions was recorded.
Supplementary Video 4
GFP-labeled donor chicken ES cells contribute to blood vessels and circulating cells in a sublethally irradiated E4 chicken embryo. This video features the same embryo shown in Supplementary Video 3. Constitutively GFP-expressing chicken ES cells were injected into the subgerminal cavity of an EGK.X-stage embryo treated with 500 cGy and incubated using the surrogate shell system. On day 4, live imaging of green fluorescence in the extra-embryonic region was recorded.
Supplementary Video 5
GFP-labeled donor quail ES cells contribute to circulating cells in a sublethally irradiated E4 chicken embryo. Constitutively GFP-expressing quail ES cells were injected into the subgerminal cavity of an EGK.X-stage chicken embryo treated with 500 cGy. The embryo was incubated using the surrogate shell system. On day 4, live imaging of green fluorescence in the extra-embryonic region was recorded.
Supplementary Video 6
GFP-labeled donor goose ES cells contribute to blood vessels and circulating cells in a sublethally irradiated E5 chicken embryo. Constitutively GFP-expressing goose ES cells were injected into the subgerminal cavity of an EGK.X-stage chicken embryo treated with 500 cGy. The embryo was incubated using the surrogate shell system. On day 5, live imaging of green fluorescence in the extra-embryonic region was recorded.
Supplementary Video 7
GFP-labeled donor quail ES cells contribute to blood vessels and circulating cells in a sublethally irradiated E8 quail embryo. Constitutively GFP-expressing quail ES cells were injected into the subgerminal cavity of a 500 cGy-treated EGK.X-stage quail embryo. The embryo was subsequently incubated in its original shell. On day 8, a window was opened in the shell, and live imaging of green fluorescence in the extra-embryonic region was recorded.
Supplementary Video 8
Confocal Z-stack of DAZL and DAPI (4,6-diamidino-2-phenylindole) staining in the goose ES cell-derived EB shown in Fig. 6b. Immunofluorescence staining was performed on day-3 EBs derived from goose ES cells, followed by confocal imaging. DAZL is shown in red and DAPI-stained nuclei are shown in blue.
Rights and permissions
Open Access This article is licensed under a Creative Commons Attribution-NonCommercial-NoDerivatives 4.0 International License, which permits any non-commercial use, sharing, distribution and reproduction in any medium or format, as long as you give appropriate credit to the original author(s) and the source, provide a link to the Creative Commons licence, and indicate if you modified the licensed material. You do not have permission under this licence to share adapted material derived from this article or parts of it. The images or other third party material in this article are included in the article’s Creative Commons licence, unless indicated otherwise in a credit line to the material. If material is not included in the article’s Creative Commons licence and your intended use is not permitted by statutory regulation or exceeds the permitted use, you will need to obtain permission directly from the copyright holder. To view a copy of this licence, visit http://creativecommons.org/licenses/by-nc-nd/4.0/.
Reprints and permissions
About this article
Cite this article
Chen, X., Guo, Z., Tong, X. et al. Derivation of embryonic stem cells across avian species. Nat Biotechnol (2025). https://doi.org/10.1038/s41587-025-02833-3
Download citation
-
Received:
-
Accepted:
-
Published:
-
DOI: https://doi.org/10.1038/s41587-025-02833-3