Educational Resources
Top Instrumentation Software for Engineers: Your Essential Toolkit
For engineers and consultants w...
TAMFIS NIG LTDRC 8067447CAC ACTIVEFinima, Bonny Island, Rivers State

In today’s technologically driven world, understanding complex analytical tools and scientific instruments is crucial for professionals across various industries. The Reid Vapour Analyzer, a pivotal device in environmental and industrial safety, plays a significant role in measuring volatile organic compounds. Parallelly, mastering data visualization and analysis through platforms like Oracle Business Intelligence Enterprise Edition (OBIEE) 12c Visual Analyzer has become indispensable for data professionals. This article offers a comprehensive exploration of the Reid Vapour Analyzer’s functionality and application, coupled with a detailed overview of the OBIEE 12c Visual Analyzer Developer Course, designed to equip learners with the skills needed to harness the power of data visualization and analytics effectively.
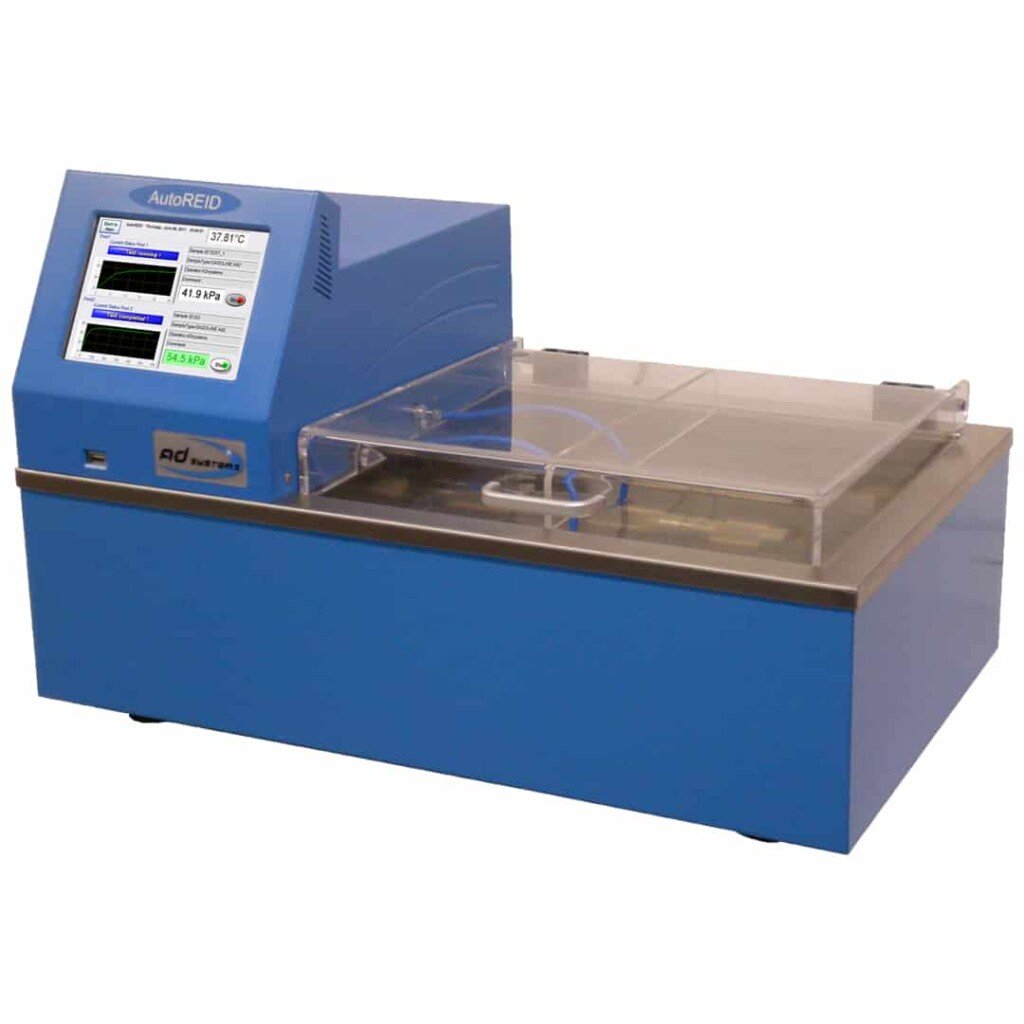
The Reid Vapour Analyzer is an analytical instrument primarily used to measure the vapor pressure of volatile substances, especially in petroleum products. Its operation is based on the Reid Vapor Pressure (RVP) test method, which determines the volatility characteristics of gasoline and other liquids. This measurement is critical for quality control, regulatory compliance, and environmental monitoring.
The analyzer works by heating a sample in a closed container and measuring the pressure exerted by the vapor at a specific temperature. This pressure correlates directly with the substance’s volatility, enabling precise determination of vapor pressure. The instrument’s design ensures accuracy and repeatability, making it a standard tool in laboratories and industrial settings.
Understanding the principles behind the Reid Vapour Analyzer helps professionals interpret results accurately and apply them in practical scenarios. It is widely used in the petroleum industry to assess fuel quality, ensure safe storage, and comply with environmental regulations aimed at reducing air pollution caused by volatile organic compounds.
Reid Vapour Analyzers find extensive application in the petroleum and chemical industries. They are essential for measuring the vapor pressure of gasoline, solvents, and other volatile liquids, which directly impacts product performance and safety. Accurate vapor pressure data is crucial for refining processes, storage tank design, and transportation safety protocols.
Environmental agencies rely on data from Reid Vapour Analyzers to monitor and regulate emissions of volatile organic compounds (VOCs), which contribute to air pollution and smog formation. The analyzer’s readings support compliance with environmental standards such as those set by the EPA and other regulatory bodies worldwide.
In addition to environmental monitoring, the analyzer aids in research and development by providing critical data for formulating new fuel blends and chemical products. Its role in ensuring product consistency and safety underscores its significance across multiple sectors.
Oracle Business Intelligence Enterprise Edition (OBIEE) 12c Visual Analyzer is a powerful data visualization and analytics tool designed to help organizations glean insights from vast datasets. It provides an intuitive interface for creating interactive dashboards, reports, and visualizations without extensive coding, making data analysis accessible to a broader audience.
Visual Analyzer supports a range of data sources and allows users to explore data through drag-and-drop functionality, enabling quick identification of trends, patterns, and anomalies. Its integration with the OBIEE suite ensures robust data governance, security, and scalability for enterprise-grade deployments.
The tool is widely adopted across industries to empower decision-makers with real-time, actionable insights. By transforming raw data into visually compelling stories, OBIEE 12c Visual Analyzer enhances business intelligence capabilities and supports strategic planning.
For developers, mastering OBIEE 12c Visual Analyzer opens up opportunities to design sophisticated business intelligence solutions tailored to organizational needs. Developers learn to create dynamic visualizations, customize dashboards, and optimize performance, which add significant value to data-driven projects.
The course enhances skills in data modeling, report development, and integration with diverse data sources, equipping developers to handle complex analytics scenarios. It also covers best practices for usability and user experience, ensuring that analytic applications meet end-user expectations.
As data volumes grow and the demand for real-time analytics increases, expertise in tools like OBIEE 12c Visual Analyzer becomes increasingly valuable. Developers proficient in this platform are well-positioned to contribute to digital transformation initiatives and drive business success.
The OBIEE 12c Visual Analyzer Developer Course typically covers foundational to advanced topics, starting with an overview of OBIEE architecture and installation. It progresses into data visualization principles, dashboard design, and report authoring using Visual Analyzer’s intuitive interface.
Participants learn to connect to various data sources, create complex visualizations such as heat maps, scatter plots, and pivot tables, and implement filters and prompts to enhance interactivity. The course also addresses performance tuning and troubleshooting techniques to optimize analytic solutions.
By the end of the training, learners gain practical experience through hands-on labs and projects, enabling them to confidently develop and deploy analytics applications. The course prepares participants for real-world challenges in business intelligence and analytics roles.
Combining the technical data obtained from Reid Vapour Analyzers with the analytical power of OBIEE 12c Visual Analyzer can significantly enhance decision-making processes. Organizations can import vapor pressure data into OBIEE to visualize trends over time, compare results across samples, and identify anomalies.
This integration facilitates comprehensive reporting that supports operational efficiency and regulatory compliance. Visual dashboards can depict key performance indicators related to product quality, safety metrics, and environmental impact, providing stakeholders with clear and actionable insights.
Moreover, by leveraging OBIEE’s advanced analytics capabilities, companies can perform predictive analysis and scenario modeling based on vapor pressure data, aiding in proactive maintenance, risk assessment, and strategic planning.
The demand for skilled OBIEE 12c Visual Analyzer developers continues to rise as organizations increasingly rely on data-driven strategies. Professionals with expertise in this tool are sought after for roles in business intelligence, data analytics, and IT consulting across diverse sectors including finance, healthcare, retail, and manufacturing.
Developers proficient in OBIEE 12c can expect opportunities to work on high-impact projects involving data integration, dashboard development, and performance optimization. Their ability to translate complex data into meaningful visual insights is invaluable for supporting executive decision-making.
Continuous learning and certification in OBIEE 12c Visual Analyzer further enhance career prospects, enabling professionals to stay current with evolving technologies and maintain a competitive edge in the job market.
To maximize learning outcomes, students should engage actively with both theoretical concepts and practical exercises throughout the course. Familiarity with SQL, data warehousing, and basic analytics principles provides a strong foundation for understanding OBIEE functionalities.
Utilizing available resources such as Oracle documentation, forums, and community tutorials can supplement formal training and help resolve challenges encountered during hands-on labs. Consistent practice in creating reports and dashboards is essential for skill mastery.
Networking with peers and instructors can provide valuable insights and support. Finally, applying learned skills to real-world projects or simulations ensures readiness to implement OBIEE 12c Visual Analyzer solutions effectively in professional settings.
The intersection of scientific instrumentation like the Reid Vapour Analyzer and advanced data visualization platforms such as OBIEE 12c Visual Analyzer represents a powerful synergy for modern industries. Understanding the technical nuances of vapor pressure measurement and leveraging sophisticated analytics tools enables organizations to enhance product quality, ensure compliance, and drive strategic insights. Pursuing the OBIEE 12c Visual Analyzer Developer Course equips professionals with the necessary skills to excel in this data-centric landscape, opening doors to rewarding career paths. As technology evolves, integrating precise measurement tools with dynamic visualization capabilities will remain a cornerstone of effective decision-making and operational excellence.
Keep reading
Educational Resources
For engineers and consultants w...
Educational Resources
Modern industrial landscapes, from vast petrochemical complexes and power generation plants to intricate manufacturing facilities, are ...
Educational Resources
Instrumentation engineering has moved far beyond basic gauges and dials. Today’s systems combine sensors...
TAMFIS NIG LTD
Electrical and instrumentation engineering, bid preparation and consulting, IT and software.