For engineers and consultants working in instrumentation, having the right software is not just a convenience; it’s a critical enabler for efficiency, accuracy, and successful project delivery. From designing complex control systems to managing calibrations and optimising plant operations, specialised software streamlines workflows and enhances decision-making.
This comprehensive guide is aimed at professionals seeking to understand and select the best instrumentation software solutions available today. We’ll explore various categories of software, highlighting leading tools and their key applications.
Introduction: The Digital Backbone of Modern Instrumentation
Instrumentation engineering sits at the heart of industrial automation, ensuring precise measurement, control, and monitoring of processes across diverse sectors like oil & gas, chemicals, pharmaceuticals, manufacturing, and energy. As industries become more complex and interconnected, the reliance on advanced software solutions has grown exponentially.
Modern instrumentation software goes beyond simple design tools. It encompasses a wide range of functionalities, including:
Simulation & Modelling: Predicting system behaviour, optimising control strategies, and testing scenarios before physical implementation.
Control System Programming: Developing logic for Programmable Logic Controllers (PLCs), Distributed Control Systems (DCS), and Human-Machine Interfaces (HMIs).
Data Acquisition & Analysis: Collecting, storing, and analysing real-time process data for monitoring, troubleshooting, and performance optimisation.
Cybersecurity: Protecting control systems from cyber threats.
Choosing the right software can significantly impact project timelines, cost-effectiveness, and operational reliability.
1. Process Design and Simulation Software
These tools are crucial for the conceptual and detailed design phases, allowing engineers to model and simulate processes before any physical construction begins.
Aspen HYSYS / Aspen Plus (AspenTech):
Overview: Industry-leading process simulation software, particularly strong in chemical, petrochemical, and refining industries. Aspen HYSYS focuses on dynamic simulation and steady-state process modelling, while Aspen Plus is more geared towards chemical processes and reaction engineering.
Key Features: Comprehensive libraries for components and unit operations, robust thermodynamic models, steady-state and dynamic simulation, process optimisation, heat exchanger design, and safety analysis.
Why Engineers Use It: To design new processes, optimise existing ones, perform feasibility studies, and troubleshoot operational issues by simulating various scenarios. Essential for achieving optimal efficiency and profitability.
AVEVA Process Simulation (formerly PRO/II, ROMeo):
Overview: A powerful suite of process simulation tools from AVEVA, offering comprehensive capabilities for designing, optimising, and validating processes across various industries.
Key Features: Steady-state and dynamic simulation, rigorous thermodynamic models, extensive component databases, integration with other AVEVA products for a complete plant lifecycle solution.
Why Engineers Use It: For accurate modelling of complex chemical and physical processes, enabling engineers to make informed decisions about process design and operation.
MATLAB & Simulink (MathWorks):
Overview: While not solely for process design, MATLAB (a numerical computing environment) and Simulink (a graphical environment for model-based design of dynamic systems) are formidable tools for dynamic simulation, control system design, and data analysis in instrumentation.
Key Features: Extensive toolboxes for control systems, signal processing, data acquisition, and fuzzy logic. Simulink allows for block-diagram based modelling, making it intuitive for simulating complex dynamic behaviour.
Why Engineers Use It: Ideal for developing, testing, and implementing advanced control algorithms (e.g., PID tuning, model predictive control), system identification, and analysing system response to disturbances. Widely used for research and development.
2. CAD and Design Software (Instrumentation Specific)
These tools facilitate the creation of detailed engineering drawings, schematics, and documentation critical for instrumentation projects.
AVEVA Instrumentation (formerly SmartPlant Instrumentation – SPI by Intergraph):
Overview: A highly specialised and widely adopted software for instrumentation and control system design and management. It’s a database-driven solution for the entire instrument lifecycle.
Key Features: Creation of P&IDs, instrument datasheets, loop diagrams, wiring diagrams, hook-ups, and a central database for all instrument data. Supports standardisation, consistency, and revision control.
Why Engineers Use It: Essential for large-scale industrial projects to ensure data integrity, generate comprehensive documentation automatically, and manage changes efficiently across disciplines. Reduces errors and improves project handover.
AutoCAD Electrical (Autodesk):
Overview: A specialized version of AutoCAD tailored for electrical control system design. While broader than just instrumentation, it’s invaluable for creating electrical schematics for control panels, wiring, and motor control circuits.
Key Features: Extensive symbol libraries for electrical components, automated wire numbering, cross-referencing, report generation (BOMs, wire lists), and PLC I/O drawings.
Why Engineers Use It: For rapid and accurate electrical schematic design, ensuring consistency and compliance with electrical standards. It automates many tedious tasks, saving significant time.
SOLIDWORKS Electrical (Dassault Systèmes):
Overview: Integrates electrical schematic design with 3D CAD, allowing engineers to combine mechanical and electrical design in a single environment.
Key Features: 2D schematic design, 3D cabinet layout, automated routing of wires and cables, real-time cross-referencing, and integration with SOLIDWORKS 3D CAD for clash detection.
Why Engineers Use It: Ideal for projects requiring close coordination between electrical and mechanical design, such as custom machinery or packaged skids. Helps prevent design errors and improves manufacturability.
3. PLC, DCS, and HMI Programming Software
These are the backbone of industrial control systems, enabling the logic that automates processes and the interfaces that operators use to interact with them.
Siemens TIA Portal (Totally Integrated Automation Portal):
Overview: A comprehensive engineering framework from Siemens that integrates PLC programming (SIMATIC STEP 7), HMI configuration (WinCC), drive control, and safety into a single software environment.
Key Features: Supports various PLC programming languages (Ladder Logic, Function Block Diagram, Structured Text, etc.), powerful simulation capabilities, integrated diagnostics, and a consistent user interface.
Why Engineers Use It: For designing and programming complete automation solutions with Siemens hardware. Its integrated nature significantly speeds up development and commissioning.
Rockwell Automation Studio 5000 (formerly RSLogix 5000):
Overview: The flagship programming software for Rockwell Automation’s Allen-Bradley Logix controllers (ControlLogix, CompactLogix).
Key Features: Supports all IEC 61131-3 programming languages, powerful tag-based architecture, extensive motion control capabilities, and integration with FactoryTalk View for HMI/SCADA.
Why Engineers Use It: Essential for programming and maintaining Allen-Bradley PLC-based control systems, widely used in discrete manufacturing and process industries.
Schneider Electric EcoStruxure Control Expert (formerly Unity Pro):
Overview: Software for programming Schneider Electric’s Modicon PLCs and PACs (Programmable Automation Controllers).
Key Features: Supports IEC 61131-3 languages, integrated diagnostics, simulation, and a modular architecture for scalable solutions.
Why Engineers Use It: For developing automation applications with Schneider Electric’s broad range of control hardware.
AVEVA System Platform (formerly Wonderware System Platform):
Overview: A leading SCADA (Supervisory Control and Data Acquisition) and HMI platform, providing real-time operational visibility and control for large-scale industrial processes.
Key Features: Centralised data acquisition, graphical HMI development (InTouch HMI), alarm management, historical data trending, reporting, and integration with enterprise systems.
Why Engineers Use It: For building robust and scalable SCADA systems that provide operators with a comprehensive view of plant operations, enabling quick decision-making and operational efficiency.
DeltaV (Emerson Automation Solutions):
Overview: A Distributed Control System (DCS) platform specifically designed for process automation. It offers a fully integrated system for control, operations, and information.
Key Features: Object-oriented design, built-in advanced control strategies, integrated alarming and historian, intuitive HMI development, and robust cybersecurity features.
Why Engineers Use It: For managing complex, continuous process plants where high reliability, safety, and precise control are paramount. Its “easy-to-use” approach simplifies configuration and maintenance.
4. Data Acquisition, Analysis, and Visualisation
These tools help engineers gather, interpret, and present crucial process data.
NI LabVIEW (National Instruments):
Overview: A graphical programming environment widely used for data acquisition, instrument control, and industrial automation. It’s particularly strong for test and measurement applications.
Key Features: Intuitive drag-and-drop graphical programming, extensive drivers for hardware (DAQ cards, instruments), real-time data analysis, and HMI development.
Why Engineers Use It: For developing custom test stands, laboratory automation systems, and rapid prototyping of control systems. Its visual nature makes it accessible for engineers without deep programming backgrounds.
OSIsoft PI System:
Overview: A leading enterprise infrastructure for managing historical and real-time operational data. It’s often referred to as an “industrial historian.”
Key Features: High-fidelity data collection from various sources, robust data storage, powerful trending and analysis tools (PI Vision, PI DataLink), and integration with business intelligence tools.
Why Engineers Use It: For long-term data archiving, performance monitoring, root cause analysis, and optimising asset utilisation across an entire plant or enterprise.
Microsoft Excel (with VBA):
Overview: While seemingly basic, Excel remains an incredibly versatile tool for instrumentation engineers for quick calculations, data logging, basic trending, and generating simple reports, often augmented with VBA (Visual Basic for Applications) for automation.
Key Features: Spreadsheet functionality, charting, pivot tables, and macro programming.
Why Engineers Use It: For ad-hoc data analysis, small-scale data collection, basic calibration sheet management, and presenting preliminary findings. It’s universally available and easy to use for many quick tasks.
5. Calibration Management Software
Ensuring instruments are accurately calibrated is vital for process quality, safety, and regulatory compliance.
Beamex CMX Calibration Management Software:
Overview: A comprehensive calibration management solution designed to streamline calibration processes, manage instrument data, and ensure compliance with industry regulations (e.g., ISO 9001, FDA).
Key Features: Calibration scheduling, automated calibration procedures, generation of calibration certificates, instrument history tracking, reporting, and integration with documenting calibrators.
Why Engineers Use It: For efficient and reliable management of calibration assets, reducing manual errors, improving audit readiness, and ensuring instrument accuracy.
ProCalV5 (Prime Technologies):
Overview: Another widely used calibration management software known for its robust features and compliance capabilities.
Key Features: Asset management, work order management, calibration data management, reporting, and support for various regulatory standards.
Why Engineers Use It: Similar to Beamex CMX, it helps organisations maintain a compliant and efficient calibration programme, particularly in highly regulated industries.
Qualityze Calibration Management:
Overview: A cloud-based calibration management solution that integrates with broader quality management systems. It leverages AI for insights into calibration data.
Key Features: End-to-end calibration management, configurable workflows, built-in compliance tools, AI-powered insights for predictive maintenance, and seamless integration with existing ERP/MES systems.
Why Engineers Use It: For a modern, flexible, and integrated approach to calibration management, especially for companies adopting cloud-based solutions and seeking advanced analytics.
While not exclusively instrumentation software, these systems are critical for managing the lifecycle of instruments and related assets.
SAP S/4HANA (Plant Maintenance Module):
Overview: A comprehensive ERP system with a powerful Plant Maintenance (PM) module that helps manage maintenance activities, including instrument calibration and asset tracking.
Key Features: Work order management, asset hierarchy, preventive maintenance scheduling, spare parts management, and integration with financial and supply chain modules.
Why Engineers Use It: For large enterprises needing an integrated system to manage all aspects of plant operations, including instrumentation maintenance and asset lifecycle.
Maximo (IBM):
Overview: A leading EAM solution that helps organisations manage physical assets and their lifecycle. It’s widely used for maintenance, operations, and inventory.
Key Features: Asset management, work management, preventive maintenance, calibration management, and reporting.
Why Engineers Use It: For robust asset management, helping to optimise maintenance strategies for instrumentation, reduce downtime, and improve asset performance.
Conclusion: Navigating the Software Landscape
The world of instrumentation software is vast and continually evolving. The “best” software solution often depends on the specific needs of a project, the industry, the existing hardware infrastructure, and the budget.
Key Considerations When Choosing Software:
Industry Standards & Compliance: Does the software support relevant industry standards (e.g., ISA, IEC) and regulatory requirements (e.g., FDA, ISO)?
Integration Capabilities: Can it seamlessly integrate with other systems (e.g., ERP, MES, other engineering software)?
Scalability: Can the software grow with your projects and organisation?
User Friendliness & Training: Is it intuitive to use, and what training resources are available?
Vendor Support & Community: What level of technical support is offered, and is there an active user community?
Cost: Consider both initial licensing costs and ongoing maintenance/subscription fees.
Cloud vs. On-Premise: Evaluate the benefits and drawbacks of cloud-based solutions versus traditional on-premise installations.
By carefully evaluating these factors and understanding the strengths of the top software solutions mentioned, engineers and consultants can make informed decisions that drive efficiency, accuracy, and ultimately, success in their instrumentation projects. The right software isn’t just a tool; it’s a strategic asset.
Modern industrial landscapes, from vast petrochemical complexes and power generation plants to intricate manufacturing facilities, are inherently complex environments where even minor malfunctions can escalate into catastrophic events. The safety of personnel, the integrity of equipment, the protection of the environment, and the continuity of operations hinge on robust safety measures. At the forefront of these defenses are advanced instrumentation systems, meticulously designed not just to monitor processes but to actively prevent and mitigate hazardous situations.
This comprehensive guide delves deep into the foundational concepts and cutting-edge technologies that underpin safety instrumentation, providing an educational and training-oriented perspective. We will explore the architecture and lifecycle of Safety Instrumented Systems (SIS), understand how Safety Integrity Levels (SIL) are determined to quantify risk reduction, and navigate the complexities of Hazardous Area Classification alongside the critical principles of Intrinsic Safety. By understanding these pillars, professionals can better appreciate the intricate dance between technology and human vigilance that ensures industrial safety.
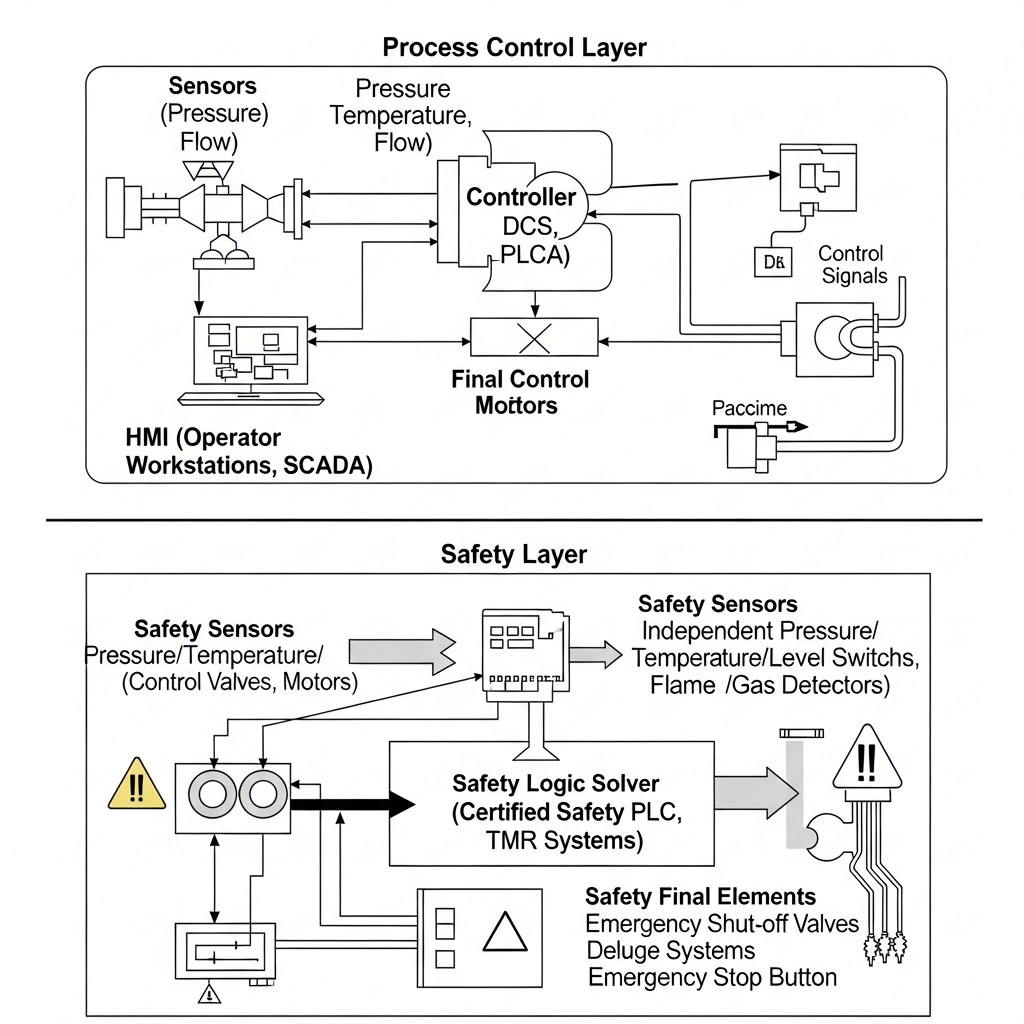
1. Safety Instrumented Systems (SIS): The Last Line of Automated Defense
Safety Instrumented Systems (SIS), often referred to as Emergency Shutdown Systems (ESD) or Process Safety Systems (PSS), represent an independent and dedicated layer of protection in industrial facilities. Their primary purpose is singular: to automatically bring a process to a safe state when predetermined hazardous conditions arise, thereby preventing accidents or mitigating their severity. Unlike basic process control systems (BPCS) which focus on operational efficiency, throughput, and product quality, SIS operates on a “fail-safe” principle, employing specialized, highly reliable hardware and software designed specifically for safety functions.
The independence of the SIS from the BPCS is paramount. This separation ensures that a failure in the basic control system does not simultaneously compromise the safety system. This independence encompasses physical separation, logical separation, and distinct management procedures, preventing common cause failures that could lead to dangerous situations. The design philosophy of SIS dictates that it should only activate when a hazardous condition is imminent or present, acting as the ultimate automated safeguard when other control layers have failed or are insufficient.
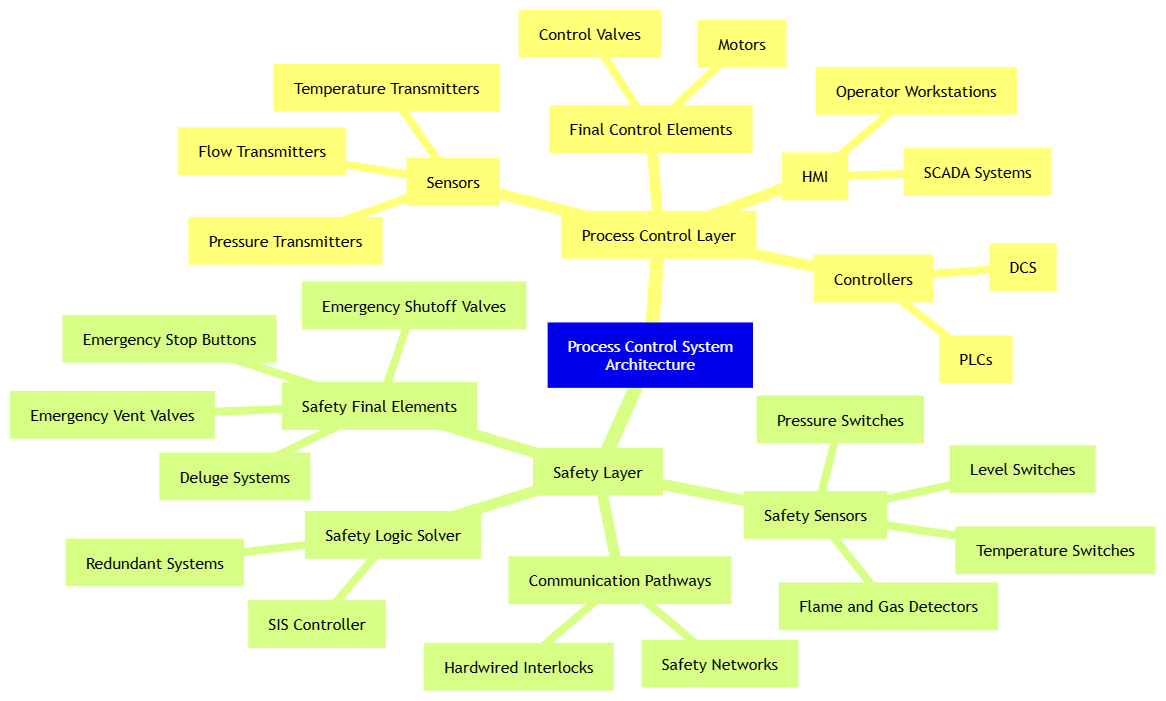
Key Components of a Safety Instrumented System
An SIS functions as a complete safety loop, from detection to action. It typically comprises three core elements that work in concert to achieve the required safety function:
1.1. Sensors (Input Elements)
These are the “eyes and ears” of the SIS, responsible for detecting abnormal or hazardous conditions within the process. Their role is to continuously monitor critical process parameters and provide accurate, reliable data to the logic solver.
Function: To accurately and reliably measure process variables (e.g., pressure, temperature, flow, level) or detect the presence of hazardous substances (e.g., flammable gases, toxic gases) that could lead to an unsafe state. The reliability of these inputs is paramount, as incorrect or failed readings can compromise the entire safety function.
Types and Applications:
Pressure Transmitters: Crucial for detecting overpressure or underpressure conditions in vessels, pipelines, or reactors, which could lead to rupture, implosion, or loss of containment.
Temperature Probes/Transmitters: Monitor excessive heating or cooling, vital for processes where exothermic reactions, freezing, or material degradation are risks. Examples include reactors, furnaces, and cryogenic systems.
Flow Meters: Detect abnormal flow rates that could indicate leaks, blockages, pump failures, or runaway reactions, ensuring proper material balance and preventing overflows or dry-run conditions.
Level Transmitters: Monitor liquid levels to prevent overfilling of tanks (leading to spills) or running dry of vessels (leading to overheating or process damage).
Gas Detectors: Essential for detecting the presence of flammable or toxic gases in the atmosphere, triggering alarms and shutdown sequences before concentrations reach dangerous levels. These are often strategically placed in areas prone to leaks.
Flame Detectors: Identify the presence of fire, typically in high-risk areas like pump alleys, storage tank farms, or loading racks, initiating fire suppression or isolation actions.
Reliability and Redundancy: Sensors used in SIS must meet stringent reliability standards. To enhance availability and prevent spurious trips (unnecessary shutdowns) or, more critically, failure to trip when required (dangerous failures), redundant configurations are often employed. Common architectures include:
1-out-of-1 (1oo1): Single sensor. Least reliable, only used for very low SILs or where consequences are minor.
1-out-of-2 (1oo2): Two sensors, if one fails, the system trips. High availability (prevents dangerous failures) but prone to spurious trips.
2-out-of-2 (2oo2): Two sensors, both must agree for a trip. Low spurious trip rate but can fail dangerously if one sensor fails undetected.
2-out-of-3 (2oo3): Three sensors, two must agree for a trip. Offers high availability and low spurious trip rate (can tolerate one sensor failure without tripping or failing dangerously). This is a common and robust architecture for higher SIL applications.
Diversity: To mitigate common cause failures (where a single event causes multiple redundant components to fail), diversity in technology (e.g., using a pressure transmitter and a level switch for an overfill protection) or manufacturer can be used.
Failure Modes: SIS sensors are designed to “fail safe” where possible (e.g., a broken wire or power loss causes a signal that initiates a safe state). However, systematic failures (e.g., incorrect calibration, environmental degradation, design flaws) must also be addressed through rigorous design, installation, testing, and maintenance protocols.
1.2. Logic Solvers (Logic Elements)
The “brain” of the SIS, responsible for processing input signals from sensors and executing predefined safety actions based on programmed logic. These are the decision-making core of the safety function.
Function: To receive signals from input devices, evaluate them against a pre-programmed safety logic (e.g., “if pressure exceeds X AND temperature exceeds Y for 5 seconds, THEN close valve Z and open vent valve A”), and send precise commands to final elements. The logic is typically based on Boolean algebra (AND, OR, NOT gates) or sequence functions.
Hardware: Typically specialized Programmable Logic Controllers (PLCs) known as Safety Instrumented Controllers (SICs) or Safety PLCs. These differ significantly from conventional PLCs used for basic process control:
Certified for Safety: They are designed, manufactured, and certified to meet the stringent requirements of functional safety standards (IEC 61508), ensuring very low probability of dangerous undetected failures.
Redundancy: Often feature redundant CPUs, power supplies, and I/O modules (e.g., Triple Modular Redundancy – TMR, Dual Redundant) for extreme fault tolerance. If one component fails, a redundant one takes over without interrupting the safety function.
Extensive Self-Diagnostics: Incorporate sophisticated internal self-diagnostic capabilities (e.g., watchdog timers, memory checks, input/output signal validation) to detect internal faults and immediately move to a safe state or signal a fault to operators, ensuring continuous monitoring of their own health.
Hardware Diversity: Some high-integrity systems may use diverse logic solver technologies in parallel to prevent systematic failures related to a specific architecture or software.
Software: Programmed using specific safety-certified programming languages (often compliant with IEC 61131-3, but with additional safety constraints and specific function blocks for safety applications). The software development process must be meticulously controlled, verified, and validated to prevent programming errors (systematic failures) that could render the SIS ineffective.
Segregation: The logic solver and its associated wiring are physically and logically segregated from the BPCS. This separation prevents interference and ensures that a malfunction in the basic control system cannot propagate to the safety system. This can involve separate control rooms, separate cabinets, and dedicated communication networks.
1.3. Final Elements (Output Elements)
These are the “muscle” of the SIS, responsible for executing the physical safety actions that bring the process to a safe state. They are the components that directly interact with the process.
Function: To directly interact with the process to bring it to a safe state. This often involves stopping energy flow, isolating hazardous materials, stopping rotation, or initiating a mitigating action in a rapid and reliable manner.
Types and Fail-Safe Design:
Safety Valves:
Emergency Shut-down (ESD) Valves: Designed to quickly close (fail-closed, FC) to isolate a process section, stop the feed of hazardous materials, or prevent flow from a ruptured line. They are spring-returned or pneumatically actuated to ensure they move to the safe position upon loss of power or air.
Blowdown Valves (BDV): Rapidly open (fail-open, FO) to vent pressure from vessels or pipelines, preventing overpressure.
Vent Valves: Used to release pressure or unwanted substances to a flare or safe vent.
Circuit Breakers/Motor Disconnect Switches: Cut off electrical power to pumps, motors, heaters, or other equipment that could contribute to a hazard if left energized. These are common in electrical safety functions.
Fire Suppression Systems: Activate deluge systems, foam systems, or inert gas release (e.g., CO2, Nitrogen) to extinguish fires or prevent their spread.
Pump Shut-off: Stopping pumps to cease fluid transfer or circulation of hazardous materials.
Criticality: The final elements are arguably the most critical part of the safety loop, as they are the last physical barrier between a hazardous condition and a potential accident. Their response time, reliability, and fail-safe design are paramount. Fast-acting valves are essential where rapid isolation is required.
Maintenance and Testing: Regular and rigorous testing (known as proof testing, discussed below) and maintenance are crucial to ensure that final elements can perform their intended safety function on demand, even after long periods of inactivity. This includes cycling valves, checking limit switches, and verifying seal integrity.
Example: In a large chemical reactor, if temperature sensors (input) detect that the internal temperature has exceeded the safe operating limit due to a cooling system failure, the Safety Instrumented Controller (logic solver) receives these signals. Based on its programmed logic, it immediately commands the Emergency Shut-down (ESD) valve (final element) on the reactant feed line to close, simultaneously opening a vent valve to depressurize the vessel and activating an emergency cooling system. This sequence prevents a runaway exothermic reaction that could lead to an explosion, demonstrating the complete, automated cycle of an SIS.
Image Suggestion:
SIS Block Diagram
Purpose: Clearly illustrates the fundamental components and their interrelationship in a safety loop, emphasizing the closed-loop nature of SIS.
SIS Process Flow/Boundary
Diagram showing the components of a Safety Instrumented System (SIS) - Sensors, Logic Solver, and Final Elements interacting with a process.]
The SIS Design Lifecycle (IEC 61511 Compliance)
The design, implementation, and operation of Safety Instrumented Systems are governed by stringent international standards, primarily IEC 61508 (Functional Safety of Electrical/Electronic/Programmable Electronic Safety-Related Systems) and its process industry-specific derivative, IEC 61511 (Functional Safety – Safety Instrumented Systems for the Process Industry Sector). These standards mandate a comprehensive risk-based lifecycle approach to ensure the integrity of the SIS throughout its entire lifespan, from initial concept to decommissioning. This systematic approach is crucial for achieving and maintaining the required Safety Integrity Level (SIL).
1. Hazard and Risk Assessment (HARA)
Purpose: This is the foundational step for all safety efforts. It involves systematically identifying all potential hazards associated with a process, assessing the risks (likelihood and severity of consequences), and determining if existing safeguards (e.g., basic process control, alarms, human intervention) are sufficient to reduce the risk to a tolerable level.
Methods: Common techniques used in this phase include:
Hazard and Operability (HAZOP) Studies: A structured and systematic examination of a complex planned or existing process or operation to identify and evaluate problems that may represent risks to personnel or equipment, or prevent efficient operation.
Process Hazard Analysis (PHA): A broad term encompassing various methods like “What-If” Analysis, Checklists, Fault Tree Analysis (FTA), and Event Tree Analysis (ETA) to identify potential hazards and their causes/consequences.
Outcome: The HARA identifies the need for Safety Instrumented Functions (SIFs) where existing safeguards are inadequate. For each identified SIF, a target Safety Integrity Level (SIL) is determined based on the residual risk that needs to be reduced.
2. Safety Requirements Specification (SRS)
Purpose: Once the HARA identifies the need for SIS and a target SIL, the SRS formally defines the functional and integrity requirements for each Safety Instrumented Function (SIF). This document is absolutely crucial as it forms the basis for the subsequent design, implementation, and verification of the SIS. It acts as the blueprint for the SIS.
Content: The SRS is a comprehensive document that specifies:
Functional Requirements: The precise process conditions that will trigger the SIF (e.g., “Pressure in vessel V-101 exceeds 15 barg”).
Safe State: The exact safe state the process must achieve upon activation (e.g., “Close valve XV-102 and open vent valve HV-103”).
Required SIL: The target Safety Integrity Level (e.g., SIL 2, SIL 3) for the SIF.
Response Time: The maximum time allowed for the SIF to bring the process to a safe state after detection of the hazardous condition.
Alarm Points: The associated alarms and their setpoints.
Bypass Conditions: Under what conditions, and for how long, the SIF can be bypassed, and what alternative safeguards are required during that time.
Manual Shutdowns: Requirements for manual initiation of the safety function.
System Diagnostics: Requirements for self-diagnostics within the SIS.
Proof Testing Requirements: Frequency and scope of testing to reveal dangerous undetected failures.
Human-Machine Interface (HMI) Requirements: How operators will interface with the SIS (e.g., indications, acknowledgements).
3. Design and Engineering
Purpose: Translating the detailed SRS into a tangible SIS architecture, selecting specific components, and ensuring the design achieves the required SIL.
Activities: This phase is highly technical and involves:
Architecture Selection: Deciding on the sensor, logic solver, and final element configurations (e.g., 1oo1, 1oo2, 2oo3 voting).
Component Selection: Choosing specific safety-certified sensors, safety PLCs, and safety valves that meet the SIL requirements and environmental conditions.
Hardware and Software Design: Developing detailed wiring diagrams, P&IDs (Piping and Instrumentation Diagrams) with SIS elements, control narratives, and programming the safety logic within the SIC.
SIL Verification (Achieved SIL Calculation): Performing quantitative calculations (using failure rate data for components) to prove that the proposed design’s achieved SIL meets or exceeds the target SIL specified in the SRS. This involves considering hardware fault tolerance, safe failure fraction, diagnostic coverage, and proof test intervals.
Common Cause Failure (CCF) Analysis: Designing to mitigate CCFs by introducing diversity, segregation, and robust installation practices.
Documentation: Preparing comprehensive engineering documentation, including loop diagrams, cause-and-effect matrices, and logic solver program details.
4. Installation and Commissioning
Purpose: Ensuring the SIS is correctly installed, wired, configured, and functions exactly as per the approved design and SRS.
Activities: This phase is critical for physical integrity and proper functionality:
Physical Installation: Mounting sensors, logic solvers, and final elements according to design specifications and hazardous area requirements.
Wiring and Connections: Meticulous wiring, ensuring proper segregation of safety circuits from non-safety circuits, and correct termination.
Pre-commissioning Checks: Verifying continuity, insulation resistance, and correct power supply.
Software Loading and Configuration: Uploading the safety logic program to the SIC and configuring all parameters.
Site Acceptance Testing (SAT) and Functional Acceptance Testing (FAT): Rigorous testing performed on site. This includes testing individual components, then entire safety loops, simulating hazardous conditions to verify that the SIS initiates the correct safety action within the specified response time. Comprehensive documentation of all test results is mandatory.
5. Operation and Maintenance
Purpose: Maintaining the integrity and effectiveness of the SIS throughout its entire operational life. This is an ongoing commitment to ensure the system remains reliable and continues to perform its safety function on demand.
Activities: This is a continuous process involving:
Proof Testing: Regular, pre-planned tests designed to reveal dangerous undetected failures that would prevent the SIS from performing its safety function. The frequency and thoroughness of these tests are directly linked to the achieved SIL. These tests often involve partially or fully actuating the safety loop components (e.g., stroking a safety valve, simulating a high-pressure condition to trigger the trip).
Bypass Management: Strict procedures for managing temporary bypasses of SIFs (e.g., during maintenance or calibration). Bypasses must be authorized, clearly indicated, time-limited, and require alternative safeguards to be in place (e.g., manual intervention, administrative controls) to cover the period the SIF is compromised.
Management of Change (MOC): Any modification to the process, equipment, SIS hardware, or SIS software (including parameter changes) must follow a formal MOC procedure. This ensures that the safety integrity of the system is not inadvertently compromised by changes, and that all documentation is updated.
Competence Management: Ensuring that all personnel involved in the operation, maintenance, testing, and modification of SIS are adequately trained, assessed, and competent. This includes engineers, technicians, and operators.
Performance Monitoring: Continuously tracking SIS performance, including spurious trip rates, dangerous failure rates, and proof test results, to identify any degradation in performance or emerging issues.
Preventive Maintenance: Routine checks, calibration, and replacement of components as per manufacturer recommendations or operational experience.
6. Decommissioning
Purpose: Safely removing the SIS when the process or facility is no longer operational or the safety function is no longer required.
Activities: Ensuring that the process is brought to a safe and stable state before the SIS is deactivated or removed, and that all hazardous materials are cleared. Proper procedures must be followed to avoid creating new hazards during the shutdown and dismantling.
This rigorous Lifecycle approach ensures that SIS integrity is maintained from conception through to disposal, forming a critical layer in the overall process safety management strategy. It’s a continuous cycle of identification, design, implementation, and verification, underpinning the safety of industrial operations.
SIS Lifecycle Flowchart
Flowchart illustrating the Safety Instrumented Systems (SIS) design lifecycle according to IEC 61511
Purpose: Visualizes the structured, cyclical, and continuous nature of the SIS management process, highlighting its systematic approach.
2. SIL (Safety Integrity Level) Determination: Quantifying Risk Reduction
Safety Integrity Level (SIL) is a critical concept in functional safety, providing a quantifiable measure of the reliability performance required for a Safety Instrumented Function (SIF). Defined by international standards IEC 61508 (Functional Safety of Electrical/Electronic/Programmable Electronic Safety-Related Systems) and IEC 61511 (Functional Safety – Safety Instrumented Systems for the Process Industry Sector), SIL ranks from 1 (lowest risk reduction) to 4 (highest risk reduction) based on the probability of a safety function failing to perform its intended action on demand. Essentially, SIL tells us “how good” a safety function needs to be to achieve the necessary risk reduction to bring a specific risk down to a tolerable level.
Understanding PFDavg and RRF
For most process industry applications, SIS operates in a “low demand” mode. This means the safety function is only called upon infrequently (e.g., once a year or less), typically in response to an abnormal event. For such systems, the primary metric for SIL determination and verification is the Probability of Failure on Demand (PFDavg).
PFDavg (Probability of Failure on Demand average): This represents the average probability that a Safety Instrumented Function (SIF) will fail to perform its specified safety function when called upon to do so. A lower PFDavg value indicates higher reliability and, therefore, a higher SIL. For example, a PFDavg of 10−3 means there is a 1 in 1,000 chance that the SIF will fail when it is needed.
RRF (Risk Reduction Factor): This is the inverse of PFDavg (RRF=PFDavg1). It quantifies how many times the risk is reduced by the implementation of the SIF. For example, an RRF of 1,000 means the SIF is expected to reduce the frequency of the hazardous event by a factor of 1,000. This is a more intuitive way for some to grasp the impact of the safety function.
The relationship between SIL, PFDavg, RRF, and the corresponding availability is crucial for understanding the performance requirements of an SIS:
SIL Level
PFDavg Range (Low Demand)
RRF Range (Low Demand)
Required Availability
Implications for Design & Complexity
SIL 1
10−1 to 10−2
10 to 100
90% – 99%
Achieved with single, well-chosen components (e.g., 1oo1 sensor/valve). Lowest complexity.
SIL 2
10−2 to 10−3
100 to 1,000
99% – 99.9%
Requires higher quality components, often some redundancy (e.g., 1oo2D logic, 1oo2 valve voting). Moderate complexity.
SIL 3
10−3 to 10−4
1,000 to 10,000
99.9% – 99.99%
Significant redundancy (e.g., 2oo3 logic, 2oo3 valve voting), high diagnostic coverage, rigorous testing. High complexity and cost.
SIL 4
10−4 to 10−5
10,000 to 100,000
99.99% – 99.999%
Extremely high redundancy and diversity, very stringent design, operation, and maintenance. Extremely rare in process industries due to prohibitive cost and complexity.
Note: While SIL 4 exists in the standards, it is rarely achieved or required in the process industry due to the extreme costs, complexity, and often unmanageable proof testing requirements involved. Most process safety applications fall within SIL 1, 2, or 3.
Methods for SIL Determination
Several structured methods are employed to determine the appropriate SIL for each Safety Instrumented Function. These methods range from qualitative to semi-quantitative, each offering different levels of rigor and precision. The choice of method often depends on the complexity of the process, the severity of the consequences, and company policy.
2.1. Risk Matrix
Description: A qualitative tool that visually represents the relationship between the likelihood (or frequency) of an event and the severity of its potential consequences. It’s a foundational tool in hazard assessment.
How it works: A grid is constructed with ‘Likelihood’ on one axis (e.g., ‘Rare’, ‘Unlikely’, ‘Possible’, ‘Likely’, ‘Frequent’, or frequency ranges like >1/year, <1/10yr) and ‘Severity’ on the other (e.g., ‘Minor Injury’, ‘Major Injury’, ‘Fatality’, ‘Multiple Fatalities’, ‘Catastrophe’). Each cell in the matrix corresponds to a specific risk level (e.g., ‘Low’, ‘Medium’, ‘High’, ‘Intolerable’), and often, a corresponding target SIL. For example, a ‘High’ risk cell might directly indicate a need for SIL 2 or 3.
Application: Primarily used for initial screening during the Hazard and Risk Assessment (HARA) phase. It provides a quick, high-level indication of required SILs. Its simplicity is an advantage, but it relies heavily on expert judgment and can lack the precision needed for complex systems. Different companies may have customized risk matrices tailored to their specific operations and risk tolerance.
2.2. Risk Graph
Description: A semi-quantitative, step-by-step decision-making tool that guides the user through a series of nodes representing different risk parameters. It’s a more structured approach than a simple risk matrix.
How it works: The graph typically starts by evaluating the potential Consequence (C) of the hazardous event (e.g., C1: minor injury, C2: serious injury, C3: single fatality, C4: multiple fatalities, catastrophe). Depending on the consequence, the path leads to evaluating the Exposure (E) of personnel to the hazard (e.g., E1: rare to frequent exposure, E4: continuous presence in the hazard zone). Then, the possibility of Avoidance (A) by personnel or other safeguards (e.g., A1: usually possible, A3: rarely possible). Finally, the Probability (P) of the unwanted event occurring without the SIF (e.g., P1: very low, P3: relatively high). Each path through the graph, based on the selected parameters, leads to a recommended SIL.
Application: Provides a more structured and transparent approach than a simple risk matrix, allowing for a more nuanced assessment by considering multiple risk parameters. It’s often used in the early stages of a project or for less complex systems where a full LOPA might be overkill.
2.3. Layer of Protection Analysis (LOPA)
Description: LOPA is a widely accepted, semi-quantitative method used to evaluate the sufficiency of Independent Protection Layers (IPLs) in reducing risks to a tolerable level. If existing IPLs are insufficient, LOPA helps determine the additional risk reduction needed, and thus the required SIL for a new or modified SIF. It bridges the gap between qualitative hazard identification and quantitative risk assessment.
How it works (Detailed Steps):
Identify Initiating Event (IE): Start by identifying a specific abnormal event that could lead to a hazardous scenario (e.g., “Pump P-101 fails to stop,” “Control valve CV-205 sticks open,” “Operator makes incorrect decision”). Determine its frequency (e.g., 0.1 events per year). This frequency is typically based on historical data or industry databases.
Determine Consequence: Identify the specific hazardous consequence that results if the initiating event occurs and no safeguards function (e.g., “Toxic gas release resulting in multiple fatalities,” “Explosion causing significant property damage and environmental contamination”).
Identify Independent Protection Layers (IPLs): List all existing, truly independent, and effective safeguards that prevent the initiating event from escalating to the consequence. Each IPL must meet strict criteria:
Independence: Independent of the initiating event and all other IPLs. A common cause cannot disable multiple IPLs.
Effectiveness: Proven to perform its safety function when called upon.
Auditability: Capable of being designed, installed, and maintained to a specified performance.
Specificity: Designed to prevent or mitigate the specific hazardous event. Examples of IPLs (excluding the SIF under analysis): Basic Process Control System (BPCS) (if it acts as a safeguard), relief valves, dikes/containment systems, fire suppression systems, and other existing SIFs (if they are truly independent of the SIF being analyzed).
Assign Probability of Failure on Demand (PFD) to each IPL: For each IPL identified, estimate its PFD. This is often based on generic industry data, vendor data, or specific plant data. For example, a well-maintained relief valve might have a PFD of 10−2.
Identify Enabling Conditions & Conditional Modifiers: These are factors that might alter the likelihood of the consequence given the initiating event.
Enabling Conditions: Conditions that must be present for the initiating event to lead to the consequence (e.g., “plant operating at high pressure”). Their probability must be factored in.
Conditional Modifiers: Factors that reduce the likelihood of the consequence given the initiating event and failure of IPLs (e.g., “effective emergency response,” “low probability of ignition,” “low occupancy in the area”). These also have associated probability values.
Calculate Mitigated Event Frequency: Multiply the Initiating Event Frequency by the PFDs of all IPLs (excluding the SIF whose SIL is being determined) and all conditional modifiers. This gives the frequency of the hazardous event if the proposed SIF isn’t there, but all other IPLs function.
Compare to Tolerable Risk: Compare the calculated unmitigated event frequency to the company’s predefined tolerable risk criteria (Target Tolerable Frequency, FTolerable).
Determine Required Risk Reduction and SIL: If the unmitigated event frequency is higher than the tolerable risk, the difference represents the additional risk reduction that the new SIF must provide. This directly translates into the required SIL for the SIF.
RRFSIF=Funmitigated/FTolerable
PFDSIF=FTolerable/Funmitigated (which is 1/RRFSIF)
Based on the calculated PFDSIF, the corresponding SIL is determined from the SIL table.
LOPA Example Scenario:
Hazardous Event: Rupture of a reactor due to runaway exothermic reaction.
Existing IPL 1: Basic Process Control System (BPCS) alarm and operator intervention. PFD = 0.1 (1 in 10 chance of failure on demand).
Existing IPL 2: Pressure Relief Valve (PSV). PFD = 0.01 (1 in 100 chance of failure on demand).
Conditional Modifier (CM): Low probability of ignition due to inert atmosphere. Probability = 0.1.
Calculate Mitigated Frequency (without new SIF): Fmitigated=FIE×PFDIPL1×PFDIPL2×PCM Fmitigated=0.1×0.1×0.01×0.1=0.00001 events/year, or 10−5 events/year.
Compare to Tolerable Risk: The current mitigated frequency (10−5/year) is higher than the tolerable risk (10−6/year).
Determine Required SIF PFD: The SIF needs to reduce the frequency from 10−5 to 10−6. PFDSIF=FTolerable/Fmitigated=10−6/10−5=0.1
Determine Required SIL: A PFD of 0.1 corresponds to SIL 1 (10−1 to 10−2). Therefore, a new SIF designed to SIL 1 is required to bring the risk to a tolerable level.
Advantages of LOPA: It provides a transparent, auditable, and semi-quantitative method that systematically analyzes risk. It explicitly identifies risk reduction gaps and clearly assigns the responsibility for bridging these gaps to specific safety functions. It’s an excellent tool for justifying investments in SIS.
Key SIL Concepts and Considerations
Beyond the determination methods, several fundamental concepts are crucial for achieving and maintaining the required SIL:
Common Cause Failures (CCF): Failures that arise from a single event or cause and affect multiple components of a safety system simultaneously, even if those components are otherwise independent (e.g., a power surge affecting all redundant sensors, a maintenance error during calibration affecting all similar devices). Design must actively mitigate CCF through diversity, segregation, and good engineering practices.
Systematic Failures: Failures related to design flaws, software bugs, incorrect configuration, inadequate procedures, human error, or environmental conditions. These are independent of operating time and cannot be quantified probabilistically in the same way as random hardware failures. They are primarily addressed through rigorous lifecycle processes, quality management, thorough verification and validation, and strict management of change (MOC).
Random Hardware Failures: Failures that occur unpredictably over time (e.g., component wear-out, electronic part failure). These are quantified by failure rates (e.g., FIT – failures in time) and are primarily addressed by architectural design (e.g., redundancy, diagnostic coverage) and the reliability of components.
Safe Failure Fraction (SFF): The ratio of safe detected failures plus dangerous detected failures plus safe undetected failures to the total failure rate. It indicates the effectiveness of diagnostics within the safety system. A higher SFF indicates that a greater proportion of dangerous failures will be detected, improving system safety.
Hardware Fault Tolerance (HFT): The ability of a functional unit to continue to perform its required function in the presence of one or more faults. For example, an HFT of 1 means the system can tolerate one fault and still perform its safety function. This often implies 1oo2 or 2oo3 architectures, where the system continues to operate safely even if one component fails.
Diagnostic Coverage (DC): A measure of the ability of the system to detect dangerous failures. High diagnostic coverage reduces the PFDavg, as detected failures can be addressed before the SIF is called upon.
Certification: Devices used in SIL-rated systems undergo rigorous testing and certification by third-party bodies (e.g., TÜV, Exida) to ensure they meet the specified reliability targets, architectural constraints, and systematic capability requirements. This includes detailed failure mode, effects, and diagnostic analysis (FMEDA) to provide reliable failure rate data.
Summary: SIL quantifies the necessary risk reduction for safety functions using a hierarchical scale from 1 to 4, directly corresponding to a required Probability of Failure on Demand (PFDavg). Its determination employs structured methods like qualitative risk matrices, semi-quantitative risk graphs, and the more rigorous Layer of Protection Analysis (LOPA), all aimed at establishing the probabilistic performance requirements for Safety Instrumented Systems. This process directly links identified process hazards with probabilistic safety targets, guiding the design and verification of safety functions to ensure adequate protection and bring residual risks down to a tolerable level.
LOPA Diagram with Numerical Example
LOPA Diagram with Numerical Example
Purpose: Clearly illustrates the LOPA process with a tangible numerical example, showing how the PFD of each layer contributes to overall risk reduction and how the required SIL is derived.
SIL Level Implications Table/Infographic
Infographic showing the increasing complexity and reliability requirements for SIL 1, SIL 2, SIL 3, and SIL 4 systems
Purpose: Provides a quick visual summary of what each SIL level implies in terms of complexity and reliability requirements.
3. Hazardous Area Classification and Intrinsic Safety: Preventing Explosions
Industrial facilities often process, store, and transport flammable liquids, gases, vapors, or combustible dusts. In certain conditions, these substances can mix with air to form an explosive atmosphere. When such an atmosphere comes into contact with an ignition source (e.g., an electrical spark, a hot surface, static electricity, open flame), an explosion can occur, leading to devastating consequences. Hazardous Area Classification is the systematic process of identifying and defining areas where such explosive atmospheres may be present, and then categorizing these areas based on the probability and duration of their occurrence. This classification is paramount as it dictates the type of electrical equipment and protection techniques that can be safely used in these zones, with Intrinsic Safety (IS) being a particularly crucial and widely used method for instrumentation.
Hazardous Area Classification
Classification follows international standards such as the IEC 60079 series (globally recognized, especially within the ATEX directives in Europe) and NFPA 70 (National Electrical Code) in North America, which uses a Division and Class system. We will primarily focus on the IEC Zones system, which is widely adopted internationally.
3.1. Zone Definitions (for Gases, Vapors, and Mists)
These zones categorize areas where explosive gas atmospheres are present based on the frequency and duration of their occurrence. This helps in selecting equipment suitable for the specific risk level.
| Zone | Gas/Vapor Risk Description | Frequency/Duration of Explosive Atmosphere (Texp) | Examples & Typical Locations ` We are building a chess game in React and have the chessboard and base functionality. Now, we want to expand it to include more real-time features like live chat functionality, move history, and basic authentication to differentiate users. To implement real-time data persistence, we want to use Firestore.
Here are the requirements for the Chat Component:
The Chat component should be displayed to the right of the chessboard.
It should include a chat input field for users to type messages.
A send button to submit messages.
A display area to show the chat history.
Each message in the display area should show the username and timestamp.
The chat history should update in real-time as new messages are added.
Messages should be stored in a Firestore collection named messages within the public data path (/artifacts/{appId}/public/data/messages).
The message document structure in Firestore should include:
userId: The ID of the user who sent the message.
username: The display name of the user.
message: The content of the chat message.
timestamp: Firestore server timestamp.
The username should be derived from the userId in a user-friendly format (e.g., “User-XXXX”).
Users should be able to authenticate anonymously if __initial_auth_token is not defined, otherwise sign in with __initial_auth_token. The userId should be the uid of the authenticated user or a randomly generated string if anonymous.
The appId and firebaseConfig global variables should be used.
Instrumentation engineering has evolved significantly with advancements in electronics, digital technologies, control theory, and artificial intelligence. Modern instrumentation systems are sophisticated assemblies of sensors, signal processing circuits, control algorithms, and computational tools that collectively measure, monitor, control, and predict systems behaviour with high precision and reliability. This comprehensive article explores advanced concepts in instrumentation, specifically focusing on signal processing, real-time control, AI integration, and predictive maintenance.
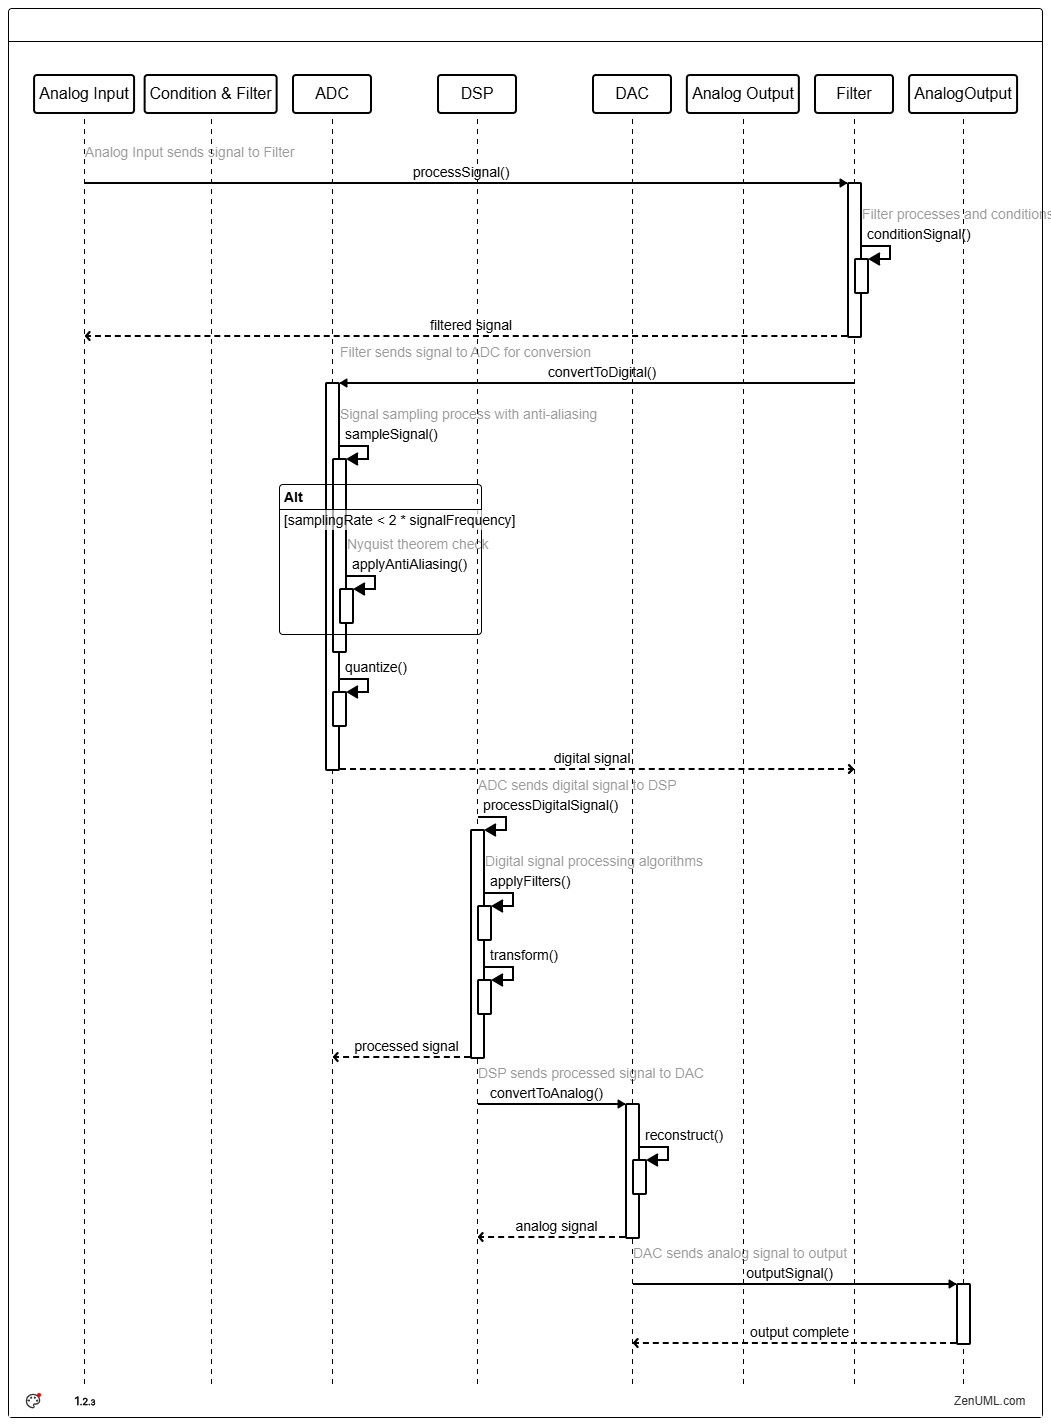
1. Signal Processing in Digital Instruments
Signal processing is fundamental to the operation of digital instruments, particularly in improving accuracy, reliability, and information extraction capabilities. With increasing demand for precision, digital instruments leverage sophisticated algorithms to handle noisy, distorted, or incomplete data gathered from sensors. Advanced signal processing techniques enable instrumental measurements to achieve unprecedented levels of sensitivity and specificity.
Key Techniques
Filtering Techniques (Digital filters): To remove noise and unwanted frequency components, filters like finite impulse response (FIR) and infinite impulse response (IIR) are used.
Fast Fourier Transform (FFT): Converts time-domain data into frequency domain to analyze signal characteristics, identifying dominant frequencies or harmonics.
Wavelet Transform: Helps extract time and frequency information simultaneously, ideal for transient event detection in signals.
Adaptive filtering: Filters capable of adjusting their parameters dynamically in response to changing signal conditions, essential in environments with variable noise.
Applications and Use-Cases
Biomedical Instrumentation: ECG and EEG signal conditioning, noise reduction, real-time diagnostics.
Communications: Signal modulation/demodulation, noise mitigation in wireless transmission.
Industrial Process Measurement: Improvement in accuracy of instruments like flow meters, pressure and temperature sensors by noise reduction and signal conditioning.
Future Directions
Emerging techniques in deep learning-based signal processing are leading to even more effective extraction and interpretation of signals, facilitating innovation in instrumentation capabilities.
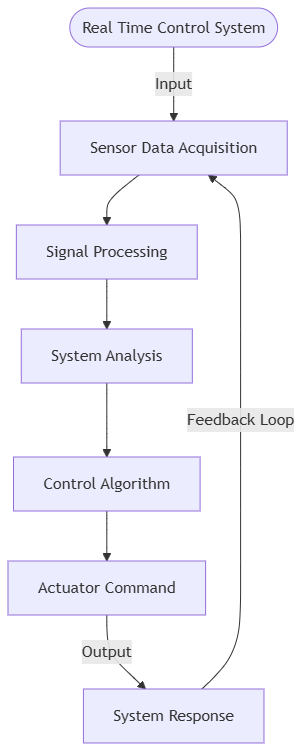
2. Real-Time Control Systems
Real-time control systems are integral to modern instrumentation engineering, enabling immediate system responses based upon real-time sensor data acquired during ongoing processes. The robustness, speed, and predictability of these systems significantly impact productivity and safety in automated and interconnected environments.
Core Principles of Real-Time Control Systems
Determinism: Maintaining strict response times in processing and execution.
Low Latency: Minimizing delay between measurement and actuation.
Reliability: Ensuring continual operation under predefined specifications without system degradation.
Predictability: Clear understanding and control over system processes and outcome timings.
Key Technologies and Frameworks in Real-Time Control
RTOS (Real-Time Operating Systems): Platforms such as FreeRTOS, RTLinux, and QNX provide deterministic resource scheduling critical for real-time control application performance.
Field-Programmable Gate Arrays (FPGAs): Used for implementation of high-speed parallel processing systems, allowing advanced real-time control algorithms to execute quickly and deterministically.
Programmable Logic Controllers (PLCs): Reliable controllers predominantly used in industrial applications to implement complex logical operations and control strategies reliably.
Application Examples
Automotive Systems: Anti-lock braking systems (ABS), airbag deployment, engine control units.
Industrial Automation: Manufacturing process control, robotics coordination.
Robotics: Precision position control, autonomous navigation and task execution.
Future Developments
Developments such as advanced multi-core processors optimally designed for determinism, increased feasibility of cloud-based real-time control platforms, and integration with artificial intelligence will continue to redefine the landscape of real-time control in instrumentation.
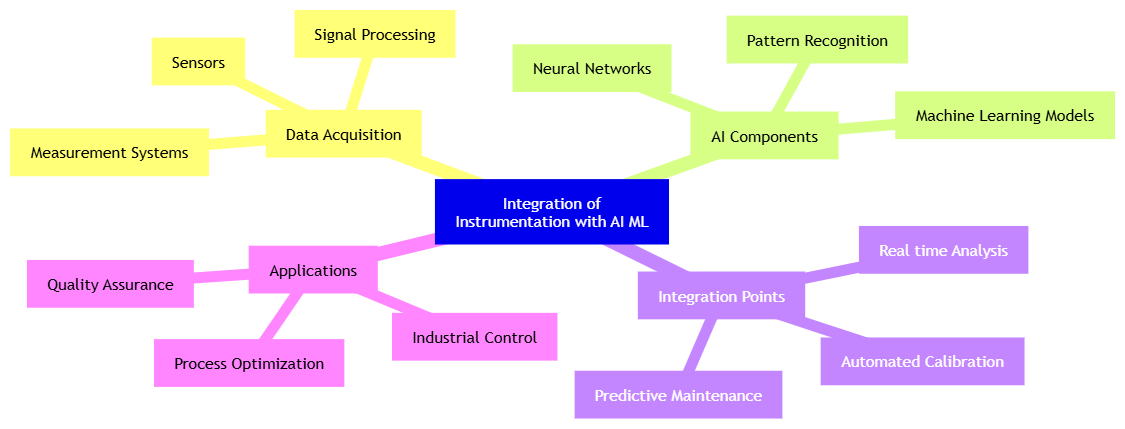
3. Integration of Instrumentation with AI and Machine Learning
Integration of Instrumentation with AI and ML
Artificial Intelligence (AI) and Machine Learning (ML) significantly enhance instrumentation systems, allowing for intelligent decision-making, data analysis, predictive capabilities, and autonomous system control. As instrumentation gathers ever greater volumes of data, AI integration helps to extract actionable insights from the abundance of available information.
Importance of AI Integration
Enhanced Measurement Accuracy: AI can dynamically calibrate signals and correct errors based on historical and real-time inputs.
Autonomous Systems: AI-driven sensing and decision-making can lead to the evolution of fully autonomous intelligent instrumentation systems.
Adaptive Control: AI algorithms enable systems to adapt capabilities dynamically, adjusting operational parameters based on evolving circumstances and data.
Common AI Techniques Used in Instrumentation
Neural Networks: Used to model nonlinear relationships between measured signals and desired outputs.
Machine Vision: Cameras coupled with image processing AI improve inspection accuracy and reduce deterioration risk.
Reinforcement Learning: Systems learn control algorithms through continuous interaction with their environment.
Predictive Analytics: ML methods analyse historical data to visualise future system states, enabling proactive control measures.
Applications in Instrumentation
Quality Control: AI-driven vision systems automatically inspect product quality with high accuracy.
Energy Efficiency in Processes: Optimise operational parameters in industrial processes to consume minimal energy without compromising product quality.
Fully autonomous AI-integrated devices, edge computing paradigms for embedded instrumentation, and real-time analytics at sensor level are key futuristic trends in instrumentation.
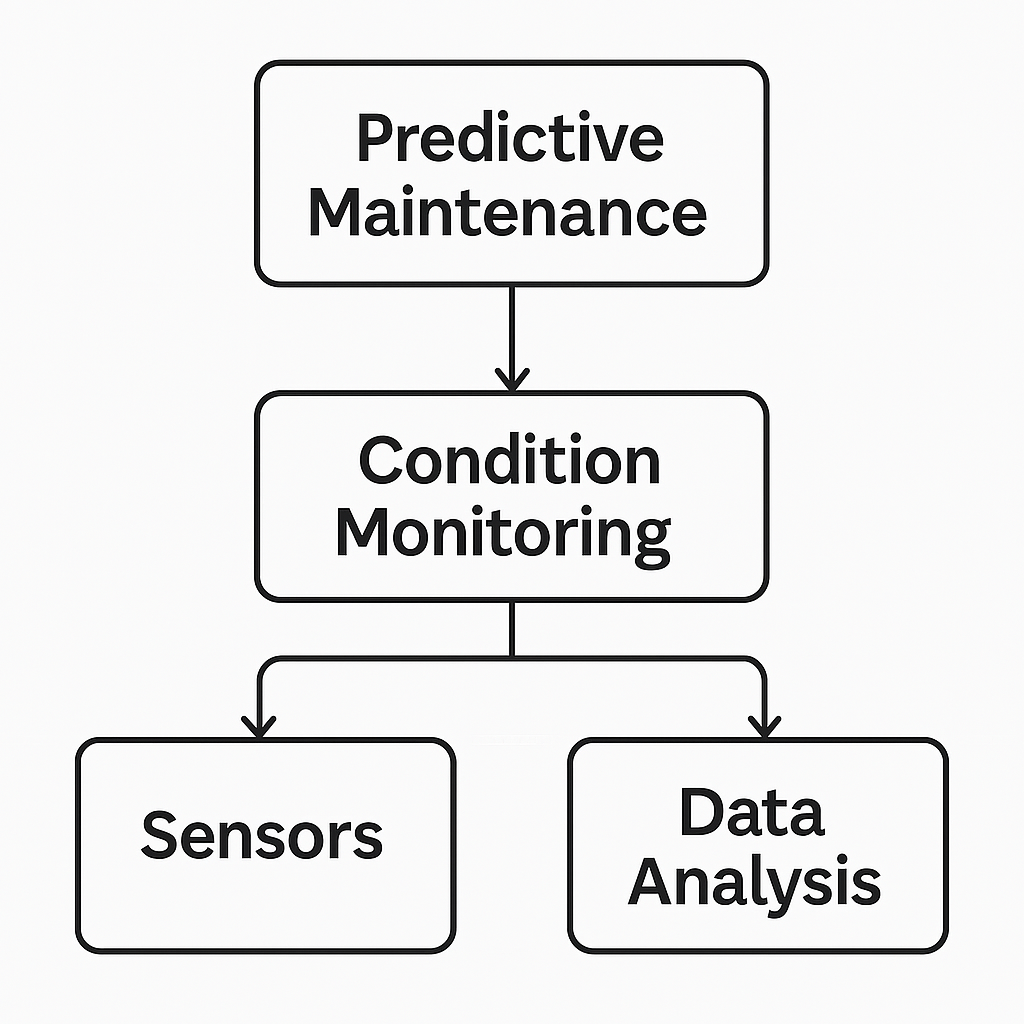
4. Predictive Maintenance and Condition Monitoring
Predictive Maintenance
Predictive maintenance and condition monitoring aim to avoid machine downtime, unnecessary maintenance, and unexpected failures by evaluating real-time operational data and using advanced analytical techniques. Effective predictive maintenance significantly reduces operational costs, enhances equipment lifespan, and improves safety.
Key Components of Predictive Maintenance Systems
Sensors and data acquisition: Sensors for pressure, temperature, vibration, and acoustic emissions to capture health status in real-time.
Data-enabled diagnostics: Condition monitoring using advanced signal analysis using FFT, wavelets, or AI-based diagnostics.
Prognostics: Predicting equipment lifespan utilising predictive analytics like ML models on collected data histories.
Maintenance scheduler: Decision support for optimal maintenance timing reducing downtime and expense.
Common Predictive Analytical Techniques
Regression Analysis: Forecast future trends, forecasting failure states and remaining-life deployments.
Classification Techniques: Categorising equipment status into varying operational or failure modes.
Anomaly Detection: Identifying early-stage faults before severe issues manifest themselves.
Applications & Benefits
Industrial Machinery: Prevention of unplanned downtime in manufacturing and production line equipment.
Aerospace and Automotive: Real-time monitoring of engines, bearings, and critical components, ensuring safety.
Energy Production: Monitoring turbines and pumps for optimised performance and longevity.
Future Outlook
In the future, predictive maintenance will likely evolve towards increased intelligence and automation, adaptive maintenance planning, and holistic integration with broader Industry 4.0 strategies.
Ultimately, advancements in instrumentation technology encompassing these advanced topics will profoundly improve human-machine interactions, system autonomy, and operational excellence across diverse domains.
Automation and Instrumentation in Industry: A Comprehensive Guide
In the dynamic landscape of modern industry, efficiency, safety, and precision are paramount. Achieving these crucial objectives relies heavily on two interconnected disciplines: automation and instrumentation. From manufacturing plants to the intricate operations of oil and gas facilities, these technologies form the backbone of contemporary industrial processes, enabling seamless control, optimisation, and rapid response to changing conditions.
This guide delves into the fundamental aspects of industrial automation and instrumentation, exploring their core principles, specific applications, the transformative impact of the Industrial Internet of Things (IIoT), and the critical role of Safety Instrumented Systems (SIS). By understanding these concepts, you’ll gain valuable insight into how industries worldwide are achieving unprecedented levels of productivity and reliability.
Industrial Automation Basics
Industrial automation refers to the use of control systems, such as computers, robotics, and other information technologies, to handle different processes and machinery in an industry to replace human intervention. The primary goal is to enhance productivity, improve quality, reduce costs, and increase safety in hazardous environments. This evolution from manual operations to automated systems has been a continuous journey, significantly shaping the industrial landscape since the first industrial revolution.
Evolution of Industrial Automation
The journey of automation started with mechanical aids, evolved through relay-based systems, and rapidly progressed with the advent of digital electronics, microprocessors, and software systems. The key milestones include:
First Industrial Revolution: Mechanisation using steam power
Second Industrial Revolution: Mass production with electrical energy
Third Industrial Revolution: Digital computing and programmable control
Historically, industrial processes relied heavily on manual labour, which was often slow, prone to human error, and inconsistent. The advent of automation addressed these limitations by introducing precision, speed, and repeatability. Today, the benefits of industrial automation are multifaceted:
Increased Productivity: Automated systems can operate continuously, 24/7, without fatigue, leading to higher output rates compared to manual processes.
Improved Quality and Consistency: Machines perform tasks with a high degree of accuracy and repeatability, minimising defects and ensuring uniform product quality.
Reduced Operational Costs: While initial investment can be significant, automation reduces labour costs, waste, and energy consumption in the long run.
Enhanced Safety: By automating dangerous or repetitive tasks, industries can remove human workers from hazardous environments, significantly reducing workplace accidents.
Optimised Resource Utilisation: Automation systems can precisely control the use of raw materials and energy, leading to less waste and greater efficiency.
Better Data Collection and Analysis: Automated systems generate vast amounts of operational data, which can be analysed to identify trends, predict failures, and improve processes.
Core Components of an Automation System
A typical industrial automation system comprises several interconnected elements working in harmony:
Sensors: These devices detect and measure physical quantities (e.g., temperature, pressure, flow, level, position) and convert them into electrical signals. Sensors provide the crucial input data that the control system needs to understand the current state of a process. Examples include thermocouples, pressure transducers, proximity sensors, and encoders.
Actuators: These are devices that receive signals from the control system and perform a physical action to control a process. They convert electrical, hydraulic, or pneumatic energy into mechanical motion. Common actuators include control valves, motors (AC/DC, servo, stepper), pumps, and robotic arms.
Controllers: The “brains” of the automation system, controllers process the input signals from sensors and generate output signals to actuators.
Programmable Logic Controllers (PLCs): Widely used in discrete manufacturing and process control, PLCs are rugged, industrial computers designed to automate specific processes. They execute logic-based programs to control machinery.
Distributed Control Systems (DCS): More complex than PLCs, DCSs are typically used in large-scale process industries (like oil refineries, chemical plants, power stations) where highly integrated control of multiple, geographically dispersed processes is required. They offer advanced control strategies, extensive data historisation, and system-wide visibility.
Industrial PCs (IPCs) and Single-Board Computers (SBCs): Used for more complex automation tasks requiring higher computing power, data processing, and integration with IT systems.
Human-Machine Interfaces (HMIs): These are graphical user interfaces that allow operators to monitor and control the automated processes. HMIs display real-time data, alarms, trends, and enable operators to adjust setpoints or initiate commands. They can range from simple push-button panels to sophisticated touchscreens and computer workstations.
Communication Networks: These facilitate the exchange of data between sensors, actuators, controllers, and HMIs. Industrial communication protocols (e.g., Modbus, Profibus, EtherNet/IP, OPC UA) are designed for robust and reliable operation in industrial environments.
Benefits of Automation
Increased Productivity: Systems work 24/7 without fatigue.
Consistent Quality: Reduces errors caused by manual operations.
Operational Safety: Removes workers from hazardous environments.
Data Acquisition: Real-time insights improve decision-making.
Types of Automation
Automation can be broadly categorised into:
Fixed Automation: Used for high-volume production of a single product. The equipment is designed to perform specific operations with little or no variation, offering high production rates but low flexibility (e.g., assembly lines for mass production).
Programmable Automation: The sequence of operations can be changed by modifying the control program. Suitable for batch production where product variety is limited, but volumes are moderate (e.g., CNC machines, industrial robots).
Flexible Automation: An extension of programmable automation, allowing for rapid and automatic changes in product design. It’s ideal for medium-volume, medium-variety production, offering high flexibility and high production rates (e.g., flexible manufacturing systems).
Integrated Automation: A holistic approach where all processes, from design to manufacturing to business functions, are integrated and controlled by computer systems. This includes Computer-Aided Design (CAD), Computer-Aided Manufacturing (CAM), and Enterprise Resource Planning (ERP) systems.
Control Loops: Open-Loop vs. Closed-Loop
A fundamental concept in automation is the control loop:
Open-Loop Control: The control action is independent of the output. The system simply executes a pre-programmed sequence without feedback (e.g., a simple timer-based sprinkler system). While simple, it’s not self-correcting.
Closed-Loop Control (Feedback Control): The control action depends on the system’s output. Sensors measure the output, and this feedback is compared to a desired setpoint. Any deviation (error) triggers the controller to adjust the actuator to bring the output back to the setpoint (e.g., a thermostat controlling room temperature). This provides accuracy and self-correction.
Industrial automation is continually evolving, driven by advancements in artificial intelligence, machine learning, and connectivity. These developments are paving the way for more intelligent, autonomous, and interconnected industrial operations.
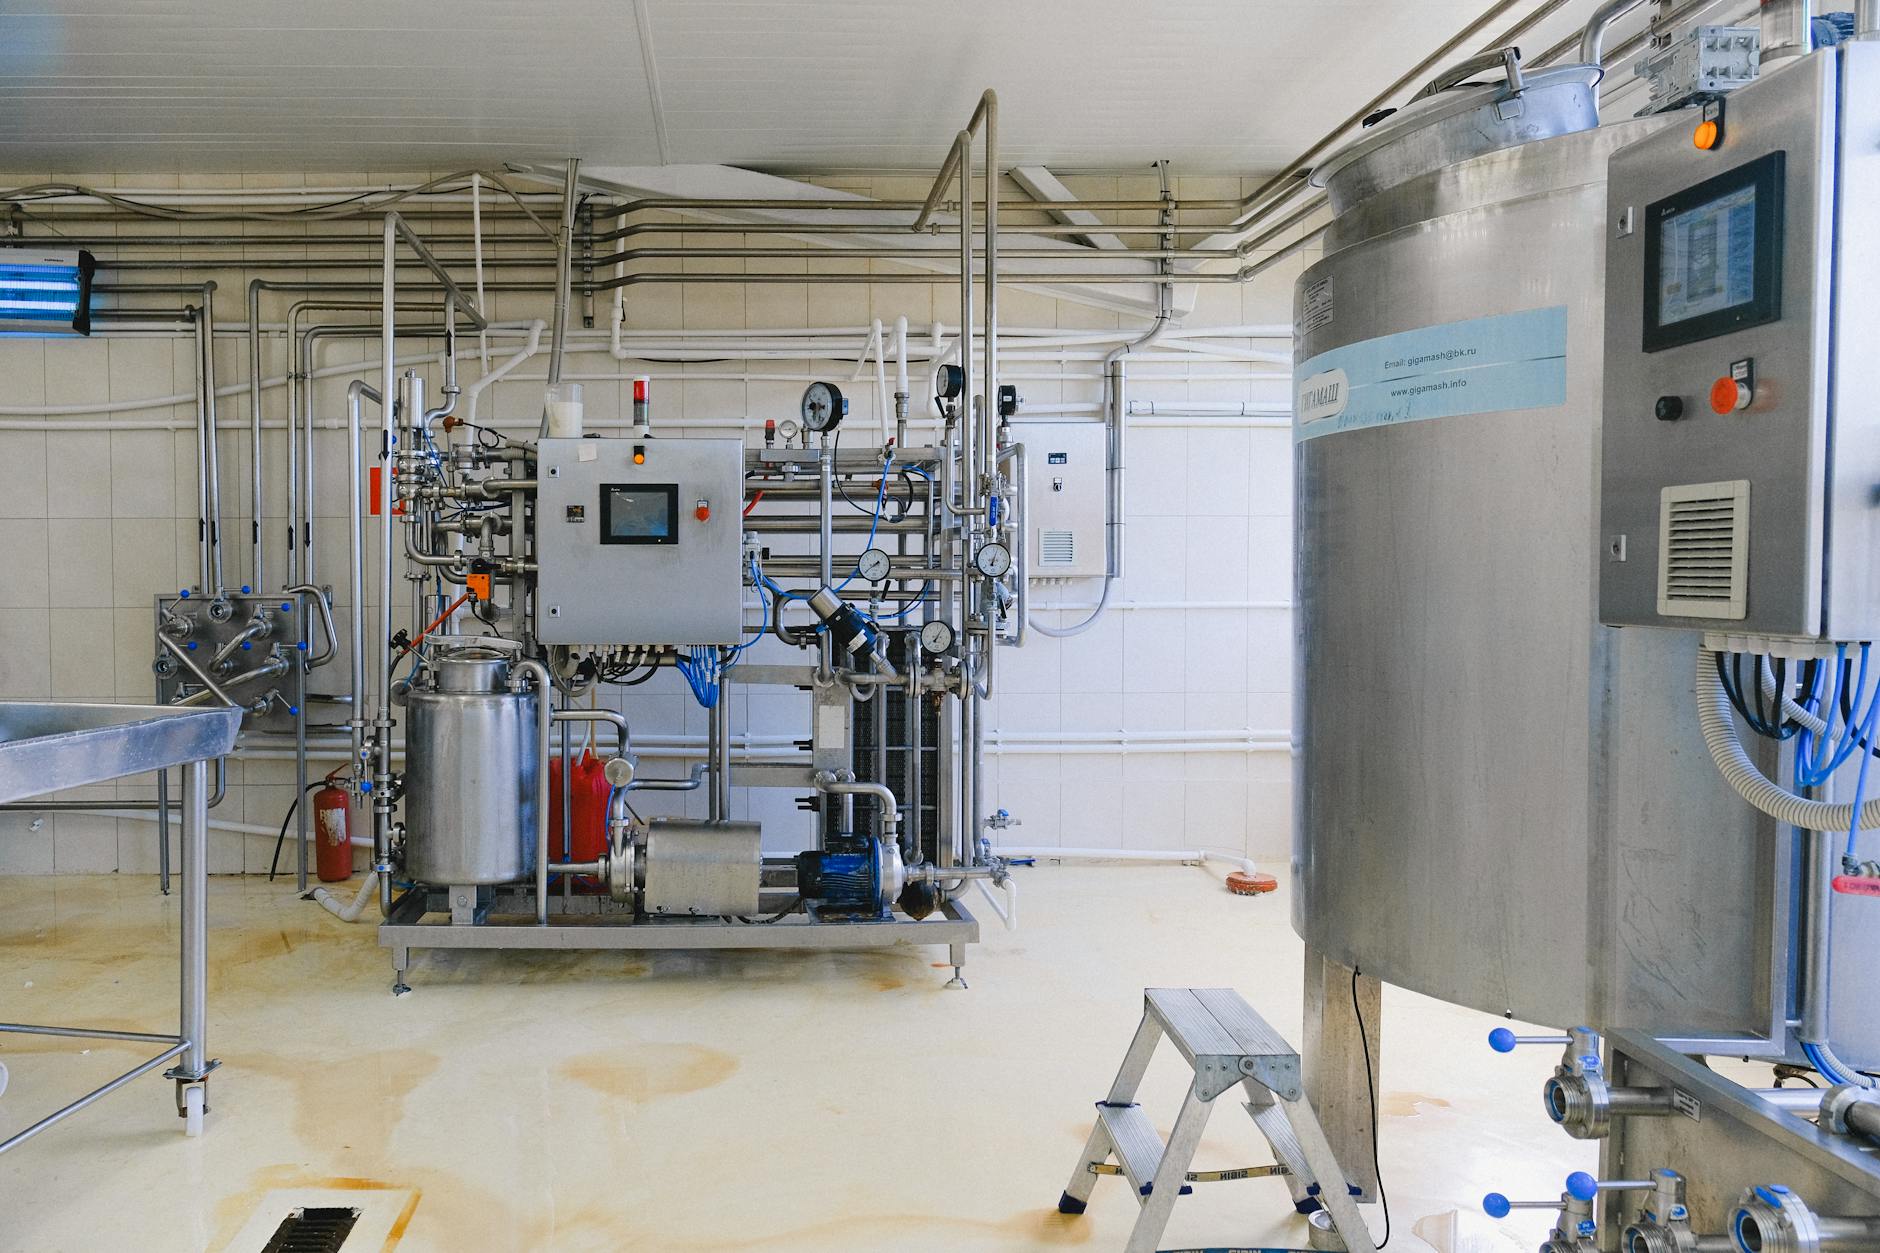
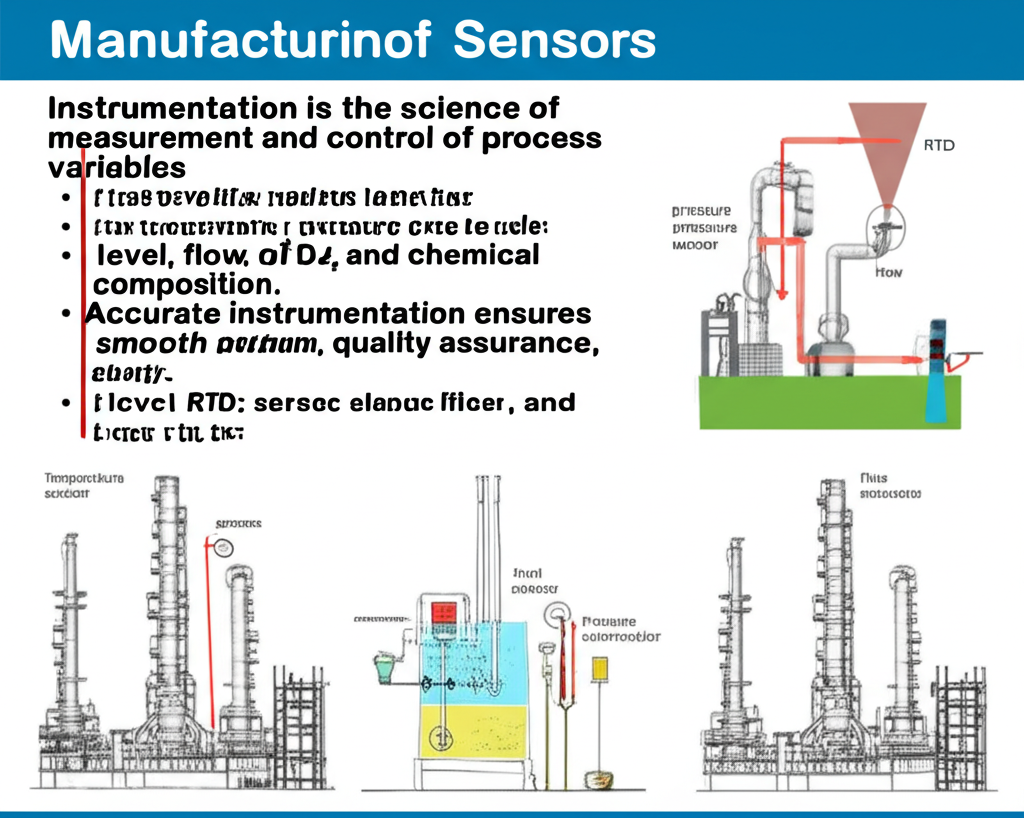
Instrumentation in Manufacturing and Oil & Gas
Instrumentation is the science and technology of measurement and control. In an industrial context, it involves the design, development, and use of instruments to measure, monitor, and control physical quantities within a process. These measurements are the eyes and ears of an automation system, providing critical data that enables effective process management and decision-making. Without accurate and reliable instrumentation, automation systems would be operating blindly, unable to maintain desired conditions or respond to anomalies.
The Indispensable Role of Instrumentation
Instrumentation is essential for:
Process Monitoring: Providing real-time data on process variables, allowing operators to understand current conditions.
Quality Control: Ensuring products meet specifications by accurately measuring parameters like temperature, pH, or concentration.
Safety: Detecting abnormal conditions (e.g., high pressure, gas leaks) that could lead to dangerous situations, triggering alarms or safety shutdowns.
Optimisation: Enabling fine-tuning of processes to maximise efficiency, reduce waste, and minimise energy consumption.
Compliance: Meeting regulatory requirements for emissions, product quality, and safety standards.
Role of Instrumentation in Manufacturing
In a manufacturing setting, instrumentation:
Monitors Critical Parameters: Ensures materials are processed under precise conditions.
Supports Process Control Systems: Integrates with PLCs and DCS (Distributed Control Systems) to regulate machines.
Improves Product Quality: Enables precision manufacturing through closed-loop control.
Instrumentation in the Oil & Gas Industry
The oil & gas sector is highly dependent on instrumentation due to:
Explosive Environments: Instruments must be explosion-proof (Ex d/Ex ia rated).
Harsh Conditions: Sensors need to withstand pressure, temperature, and corrosion.
Pipeline Monitoring: Flowmeters and pressure sensors track oil or gas flow rates to prevent leaks and ensure compliance.
Common Industrial Instruments
Instrument Type
Parameter Measured
Application Example
Thermocouples/RTDs
Temperature
Heat exchangers, furnaces
Pressure Transmitters
Pressure
Compressors, vessels
Level Sensors
Liquid Level
Storage tanks
Flow Meters
Flow Rate
Pipelines, fuel lines
pH/Conductivity Meters
Chemical Composition
Water treatment, chemical plants
Common Industrial Measurements and Instruments
The four most commonly measured process variables in industrial settings are temperature, pressure, flow, and level. Each requires specific types of instruments:
Temperature Measurement:
Thermocouples: Based on the Seebeck effect, where a voltage is produced when two dissimilar metals are joined at two points and these points are at different temperatures. They are robust, wide-ranging, and commonly used in high-temperature applications.
Resistance Temperature Detectors (RTDs): Utilise the principle that the electrical resistance of a metal changes with temperature. Platinum RTDs (Pt100) are very accurate and stable, ideal for precise measurements.
Thermistors: Semiconductors whose resistance changes significantly with temperature, offering high sensitivity but a more limited temperature range.
Infrared Thermometers: Non-contact devices that measure temperature by detecting the infrared radiation emitted by an object, useful for moving targets or hazardous surfaces.
Pressure Measurement:
Pressure Transmitters: Convert pressure into an electrical signal (e.g., 4-20 mA or digital signal). They often use diaphragms that deform under pressure, and this deformation is converted into an electrical signal via strain gauges or capacitive sensors.
Manometers: Basic instruments that measure pressure using a column of liquid.
Bourdon Tubes: A coiled or C-shaped tube that tends to straighten under internal pressure, used in mechanical pressure gauges.
Diaphragm Seals: Used to protect pressure instruments from corrosive, viscous, or very hot process fluids, by isolating the instrument with a flexible diaphragm and a fill fluid.
Flow Measurement:
Orifice Plates, Venturi Meters, and Nozzles: These are differential pressure flow meters that create a pressure drop across a restriction, with the flow rate calculated from the pressure differential.
Magnetic Flow Meters (Magmeters): Ideal for conductive liquids, these meters operate on Faraday’s law of electromagnetic induction, measuring the voltage induced by the fluid moving through a magnetic field.
Coriolis Flow Meters: Measure mass flow directly, regardless of fluid density or viscosity, by measuring the inertial forces caused by fluid flowing through vibrating tubes. Highly accurate and versatile.
Ultrasonic Flow Meters: Use sound waves to measure flow velocity, suitable for liquids and gases, and can be clamp-on (non-invasive).
Turbine Flow Meters: Measure flow by the rotational speed of a turbine rotor placed in the flow path.
Level Measurement:
Differential Pressure Level Transmitters: Measure the hydrostatic pressure exerted by the liquid column to determine level.
Ultrasonic Level Transmitters: Emit sound waves that bounce off the liquid surface; the time taken for the echo to return indicates the level.
Radar Level Transmitters: Similar to ultrasonic but use microwave pulses, effective in challenging environments (e.g., vapours, varying temperatures).
Float Switches: Simple mechanical devices that detect a specific liquid level using a buoyant float.
Capacitance Level Transmitters: Measure changes in capacitance between a probe and the tank wall as the liquid level changes.
Instrumentation in Specific Industries
Manufacturing: In discrete manufacturing (e.g., automotive, electronics), instrumentation ensures precise positioning, temperature control in ovens, pressure regulation in pneumatic systems, and quality control through vision systems. In process manufacturing (e.g., food and beverage, pharmaceuticals), instruments monitor and control mixing ratios, fermentation temperatures, pH levels, and flow rates to ensure product consistency and safety. Calibration of instruments is crucial to maintain accuracy, and regular maintenance ensures reliability and longevity.
Oil & Gas: The oil and gas industry presents some of the most challenging environments for instrumentation due to extreme pressures, temperatures, corrosive fluids, and hazardous atmospheres.
Upstream (Exploration & Production): Instruments measure reservoir pressure, flow rates from wells, gas-oil-water ratios, and drilling parameters. Subsea instrumentation must withstand immense pressures and operate reliably for long periods.
Midstream (Transportation): Pipelines rely on instrumentation for pressure monitoring to detect leaks, flow measurement for custody transfer, and temperature sensing for pipeline integrity. Compressor stations and pumping stations are heavily automated and instrumented.
Downstream (Refining & Petrochemicals): Refineries are highly complex chemical plants where instrumentation is critical for controlling distillation columns, reactors, heat exchangers, and storage tanks. Precise temperature, pressure, flow, and level control are vital for efficiency, product quality, and safety in handling flammable and toxic substances.
Hazardous Area Classification: Instruments used in oil and gas must comply with strict regulations for hazardous area classification (e.g., ATEX, IECEx) to prevent ignition of flammable gases or dusts. This often requires intrinsically safe, flameproof, or purged enclosures.
The continued advancement in sensor technology, including miniaturisation and integration with communication capabilities, is revolutionising how instrumentation contributes to operational excellence and safety across all industries.
Industrial Internet of Things (IIoT) and Smart Instrumentation
The Industrial Internet of Things (IIoT) represents the convergence of information technology (IT) and operational technology (OT), extending the concept of the Internet of Things (IoT) to industrial applications. It involves connecting industrial assets, sensors, and machines to the internet, enabling them to collect, exchange, and analyse vast amounts of data. This paradigm shift is transforming industries by creating highly integrated, intelligent, and responsive operational environments.
The IIoT Ecosystem
At its core, the IIoT ecosystem comprises:
Connected Devices (Things): These are the industrial assets, equipment, and, crucially, smart instruments equipped with sensors and communication capabilities.
Connectivity: Networks (wired or wireless, e.g., Wi-Fi, Ethernet, 5G, LoRaWAN) that enable data transmission from the devices to the cloud or edge computing platforms.
Data Collection and Processing: Gateways and edge devices that collect raw data from devices, filter, aggregate, and pre-process it before sending it further.
Cloud Computing/Data Centres: Centralised platforms for storing, processing, and analysing large datasets using advanced analytics, machine learning, and artificial intelligence.
Analytics and Applications: Software applications that interpret the processed data to generate actionable insights, predictive models, and visualisations for operators and management.
User Interfaces: Dashboards and HMIs that present these insights to human users, enabling informed decision-making and control.
The Rise of Smart Instrumentation
Traditional instruments primarily focused on a single measurement and output. Smart instruments, a cornerstone of the IIoT, go beyond simple measurement. They incorporate microprocessors, embedded software, and communication capabilities, enabling:
Self-Diagnostics: Smart instruments can monitor their own health and performance, detecting calibration drifts, sensor failures, or other anomalies and often communicating these issues proactively.
Wireless Communication: Many smart instruments are now wireless (e.g., using WirelessHART, ISA100.11a), reducing installation costs, increasing flexibility, and enabling monitoring in remote or hard-to-reach locations.
Multi-Variable Sensing: A single smart instrument can measure multiple process variables simultaneously (e.g., a smart flow meter might also measure temperature and pressure).
Remote Configuration and Calibration: Instruments can be configured, calibrated, and troubleshot remotely, reducing the need for on-site visits.
Enhanced Data Capabilities: They can store historical data, perform local calculations, and communicate richer diagnostic information beyond just the primary process variable.
Transformative Benefits of IIoT and Smart Instrumentation
The integration of IIoT and smart instrumentation offers profound advantages for industrial operations:
Predictive Maintenance: By continuously monitoring equipment health and performance data (vibration, temperature, current draw), IIoT systems can predict potential equipment failures before they occur. This shifts maintenance from reactive (breakdown repairs) or preventative (scheduled, time-based) to predictive, minimising downtime, reducing maintenance costs, and extending asset lifespan.
Remote Monitoring and Control: Operators can monitor and control processes from anywhere, enhancing operational flexibility and reducing the need for personnel in hazardous areas. This is particularly beneficial for geographically dispersed assets like pipelines or remote oil wells.
Operational Optimisation: Real-time data from IIoT-enabled systems provides unparalleled insight into process performance. Advanced analytics can identify inefficiencies, optimise energy consumption, improve resource allocation, and fine-tune process parameters for maximum output and quality.
Data-Driven Decision Making: The abundance of data, combined with powerful analytics tools, empowers management and operators to make more informed and strategic decisions, moving away from intuition-based approaches.
Enhanced Safety: By continuously monitoring conditions and identifying anomalies, IIoT systems can provide early warnings of potential safety hazards, allowing for proactive interventions and reducing the risk of incidents. This can include monitoring gas leaks, equipment stress, or deviation from safe operating limits.
Supply Chain Optimisation: IIoT can track assets, inventory levels, and logistics in real-time, leading to more efficient supply chain management and reduced lead times.
Challenges and Considerations
Despite the significant benefits, implementing IIoT and smart instrumentation comes with challenges:
Cybersecurity: Connecting operational technology to the internet opens up new vulnerabilities. Robust cybersecurity measures are paramount to protect critical infrastructure from cyber threats.
Data Integration and Interoperability: Integrating data from disparate legacy systems and various communication protocols can be complex.
Scalability: Managing and processing the vast amounts of data generated by IIoT devices requires scalable infrastructure and sophisticated data management strategies.
Skill Gap: A shortage of professionals with expertise in both IT and OT, as well as data science and analytics, can hinder adoption.
Initial Investment: The capital expenditure for IIoT infrastructure and smart instruments can be substantial, requiring a clear return on investment (ROI) justification.
The IIoT and smart instrumentation are not merely technological upgrades; they represent a fundamental shift in how industries operate, paving the way for truly smart factories, digital oilfields, and interconnected enterprises that are more agile, efficient, and resilient.
Safety Instrumented Systems (SIS)
In industrial environments, particularly in process industries dealing with hazardous materials or extreme conditions, the risk of accidents is ever-present. While basic process control systems (BPCS) are designed to keep a process operating efficiently within its normal operating limits, they are not primarily intended to mitigate abnormal, hazardous situations. This is where Safety Instrumented Systems (SIS) come into play. A SIS is a dedicated, independent, and highly reliable system designed specifically to prevent hazardous events or to mitigate their consequences, bringing a process to a safe state when normal controls fail or dangerous conditions arise.
The Purpose of SIS: Preventing Catastrophe
The core purpose of a SIS is to provide a layer of protection against potentially catastrophic failures of the process or its basic control system. It acts as an independent safety net. Consider a chemical reactor: the BPCS might control temperature and pressure for optimal reaction, but if a cooling system fails and temperature escalates dangerously, the SIS would detect this, trip the heat input, and potentially dump emergency coolant, preventing an explosion.
Distinction from Basic Process Control Systems (BPCS)
It’s crucial to understand the functional separation between SIS and BPCS:
BPCS (Basic Process Control System): Focuses on process control, efficiency, and maintaining desired operating conditions (e.g., using a DCS or PLC for continuous temperature control).
SIS (Safety Instrumented System): Focuses solely on safety, acting independently of the BPCS. Its function is to detect hazardous conditions and automatically initiate predefined safety actions to bring the process to a safe state. While a BPCS failure might lead to lost production, a SIS failure could lead to injury, fatalities, or environmental disaster.
To ensure independence, SIS components (sensors, logic solvers, final elements) are often separate and distinct from those used in the BPCS, and they follow different design, installation, and maintenance protocols.
Key Standards and the Safety Life Cycle
The design, implementation, and operation of SIS are governed by rigorous international standards to ensure their reliability and effectiveness. The most prominent are:
IEC 61508: Functional safety of electrical/electronic/programmable electronic safety-related systems (E/E/PE systems): This is the umbrella standard, providing a generic framework for the functional safety of E/E/PE systems in general. It sets requirements for the entire safety life cycle.
IEC 61511: Functional safety – Safety instrumented systems for the process industry sector: This standard is derived from IEC 61508 and specifically applies to SIS in the process industry. It outlines the requirements for SIS during the entire safety life cycle, from hazard identification to decommissioning.
The Safety Life Cycle is a structured approach mandated by these standards to manage functional safety. It typically includes:
Hazard and Risk Assessment: Identifying potential hazards (e.g., fire, explosion, toxic release) and assessing the risks associated with them. Techniques like HAZOP (Hazard and Operability Study) and LOPA (Layers of Protection Analysis) are commonly used.
Allocation of Safety Functions to Protection Layers: Determining which safety functions are required to mitigate identified risks and allocating them to different layers of protection, including the SIS.
Safety Requirements Specification (SRS): Documenting the specific requirements for each Safety Instrumented Function (SIF), including the Safety Integrity Level (SIL).
SIS Design and Engineering: Designing the SIS hardware (sensors, logic solver, final elements) and software according to the SRS.
Installation, Commissioning, and Validation: Installing the SIS, bringing it into operation, and rigorously testing it to ensure it meets the SRS and SIL requirements.
Operation and Maintenance: Operating the SIS, performing regular proof testing, and maintaining its integrity throughout its lifespan.
Modification and Decommissioning: Managing changes to the SIS and its eventual safe decommissioning.
Components of a Safety Instrumented System
Like a BPCS, a SIS consists of three main components, but with a heightened focus on reliability and fault tolerance:
Sensors: These detect the hazardous process condition (e.g., high temperature, high pressure, abnormal level). Unlike standard process sensors, SIS sensors are often redundant (multiple sensors measuring the same variable) and designed for high reliability and diagnostic coverage. Examples include safety-rated pressure transmitters, temperature sensors, or flame detectors.
Logic Solver: This is the “brain” of the SIS, receiving signals from the sensors and executing the programmed safety logic to determine if a safety action is required.
Safety PLCs: Specialised programmable logic controllers designed for safety applications. They have built-in diagnostics, redundancy, and certified safety functions. They are distinct from standard industrial PLCs in their architecture and programming environment.
Relay-based Logic: For simpler, older systems, hardwired relays can form the logic solver, though these are less common in modern complex systems.
Final Elements: These are the devices that execute the safety action to bring the process to a safe state. They often include:
Safety Shutoff Valves (SSVs): Designed to rapidly close or open to isolate flow, vent pressure, or divert material away from a hazardous area. They are often “fail-safe,” meaning they move to a safe position (e.g., fully closed) upon loss of power or signal.
Emergency Shutdown (ESD) Pumps/Motors: Devices that can be stopped or started to mitigate a hazard.
Relief Valves: While passive, they are often considered as a final layer of protection in conjunction with SIS.
SIS vs BPCS (Basic Process Control System)
Feature
SIS
BPCS
Purpose
Safety
Control
Priority
High (fail-safe)
Operational performance
Redundancy
Yes (often 2oo3, 1oo2)
Not always
Standards
IEC 61508, IEC 61511
ISA-88, ISA-95
Safety Integrity Level (SIL)
A crucial concept in SIS is the Safety Integrity Level (SIL). SIL is a measure of the probability of a safety instrumented function (SIF) failing to perform its intended safety function when required. It quantifies the risk reduction provided by a SIF.
There are four SIL levels, ranging from SIL 1 (lowest integrity, least risk reduction) to SIL 4 (highest integrity, greatest risk reduction):
SIL 1: A relatively low level of risk reduction, suitable for minor hazards.
SIL 2: A moderate level of risk reduction, common for significant hazards.
SIL 3: A high level of risk reduction, typically applied to major hazards with potentially severe consequences.
SIL 4: An extremely high level of risk reduction, reserved for the most catastrophic hazards, often requiring very complex and highly redundant systems (rare in practice).
Key Components of SIS
Sensors: Detect unsafe conditions (e.g., high pressure, high temperature)
Final Elements: Devices like ESD (Emergency Shut Down) valves, motor trips
SIL Level
Risk Reduction Factor
Probability of Failure on Demand
SIL 1
10 – 100
≥ 10⁻² to < 10⁻¹
SIL 2
100 – 1,000
≥ 10⁻³ to < 10⁻²
SIL 3
1,000 – 10,000
≥ 10⁻⁴ to < 10⁻³
SIL 4
10,000 – 100,000
≥ 10⁻⁵ to < 10⁻⁴
Achieving a specific SIL requires a combination of high-reliability components, redundancy, diagnostics, and rigorous testing.
The target SIL for each SIF is determined during the hazard and risk assessment phase, based on the severity of potential consequences and the likelihood of the hazardous event occurring without the SIF. Achieving a particular SIL requires specific design architectures, component selection (certified safety-rated devices), testing regimes, and maintenance practices.
Importance of Functional Safety Culture
Implementing SIS is not just about installing hardware and software; it requires a strong functional safety culture within an organisation. This includes:
Competent Personnel: Ensuring that engineers, technicians, and operators involved in SIS have the necessary training and expertise.
Robust Procedures: Establishing clear procedures for design, installation, testing, maintenance, and modification of SIS.
Documentation: Meticulous documentation of the safety life cycle, including SRS, design documents, test reports, and maintenance logs.
Regular Audits: Periodic independent audits to ensure compliance with standards and internal procedures.
Safety Instrumented Systems are a non-negotiable aspect of modern industrial safety, providing the ultimate safeguard against the inherent risks of complex industrial processes. Their rigorous design and operational requirements reflect the critical role they play in protecting lives, assets, and the environment.
Functional Safety Lifecycle
Outlined in IEC 61511, the lifecycle includes:
Hazard and Risk Assessment
Safety Requirements Specification
SIS Design and Engineering
Installation and Commissioning
Operation and Maintenance
Periodic Proof Testing
Decommissioning
Conclusion
The journey through industrial automation and instrumentation reveals a complex yet fascinating interplay of technology, engineering, and safety. From the foundational principles of automation that drive efficiency and consistency, to the precise measurements provided by instrumentation in demanding environments like manufacturing and oil & gas, these disciplines are fundamental to modern industry.
The advent of the Industrial Internet of Things and smart instrumentation has ushered in an era of unprecedented connectivity and data-driven insights, enabling predictive maintenance, remote operations, and continuous optimisation. Crucially, underlying all these advancements is the unwavering commitment to safety, exemplified by Safety Instrumented Systems (SIS), which stand as independent guardians against potential catastrophic failures.
As industries continue to evolve, integrating cutting-edge technologies like artificial intelligence, machine learning, and advanced analytics, the roles of automation and instrumentation will only grow in importance. They are not merely tools but strategic enablers that ensure processes are not only productive and efficient but also inherently safe and resilient in the face of ever-increasing complexity. Embracing these technologies and understanding their nuances is key for any organisation striving for operational excellence and a secure future.
Further Reading & References
International Society of Automation (ISA) – www.isa.org
IEC 61511 Standard: Functional Safety – Safety Instrumented Systems for the Process Industry Sector